OPEN-SOURCE SCRIPT
更新済 Relative Volume (RVOL)
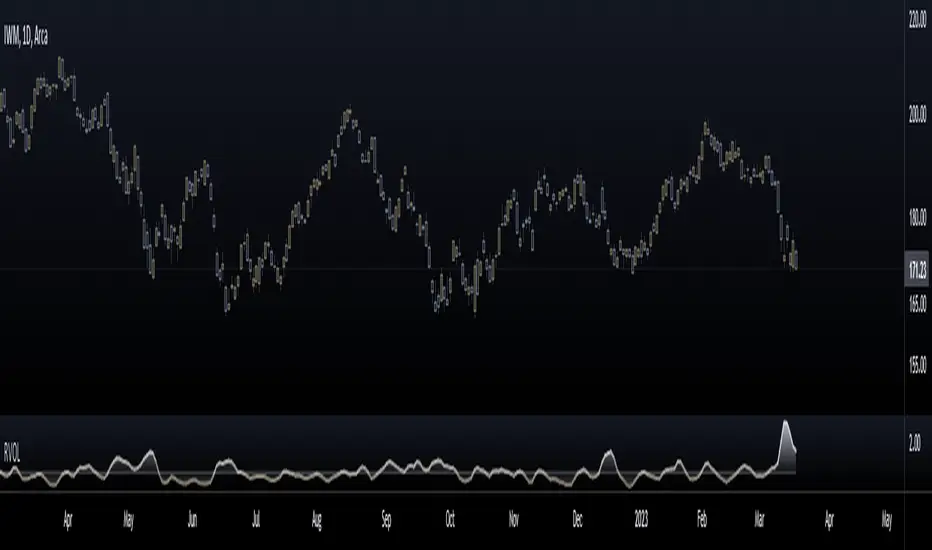
Relative Volume is calculated by taking the ratio of current volume relative to a moving average of your choice. It gives you a quick way to see how much volume is involved in the current movement relative to a recent period.
Features:
-Customizable Moving Average: You can choose the period (default is 21) and type (SMA or EMA)
-Customizable base level: Default setting is 1.
-Smoothing option: Uses a Hull moving average to smooth out the RVOL area plot, by default its turned off.
Enjoy!
Features:
-Customizable Moving Average: You can choose the period (default is 21) and type (SMA or EMA)
-Customizable base level: Default setting is 1.
-Smoothing option: Uses a Hull moving average to smooth out the RVOL area plot, by default its turned off.
Enjoy!
リリースノート
Updated to Pine V5Updated gradient Fill and RVOL line is now also gradient line.
オープンソーススクリプト
TradingViewの精神に則り、このスクリプトの作者はコードをオープンソースとして公開してくれました。トレーダーが内容を確認・検証できるようにという配慮です。作者に拍手を送りましょう!無料で利用できますが、コードの再公開はハウスルールに従う必要があります。
免責事項
この情報および投稿は、TradingViewが提供または推奨する金融、投資、トレード、その他のアドバイスや推奨を意図するものではなく、それらを構成するものでもありません。詳細は利用規約をご覧ください。
オープンソーススクリプト
TradingViewの精神に則り、このスクリプトの作者はコードをオープンソースとして公開してくれました。トレーダーが内容を確認・検証できるようにという配慮です。作者に拍手を送りましょう!無料で利用できますが、コードの再公開はハウスルールに従う必要があります。
免責事項
この情報および投稿は、TradingViewが提供または推奨する金融、投資、トレード、その他のアドバイスや推奨を意図するものではなく、それらを構成するものでもありません。詳細は利用規約をご覧ください。