OPEN-SOURCE SCRIPT
CAGR + Log Slope Color
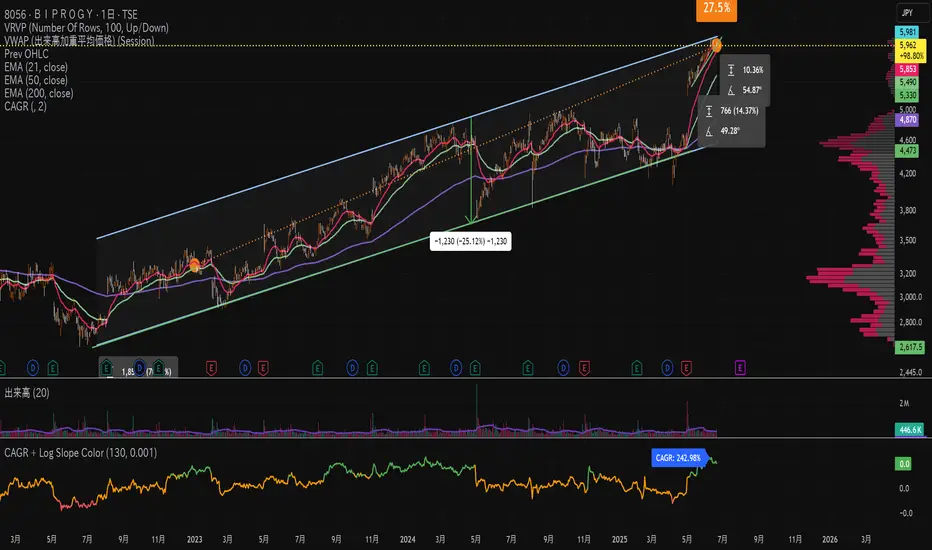
This custom TradingView indicator combines two important analytical concepts to help traders identify strong trends with visual clarity:
CAGR (Compound Annual Growth Rate):
Measures the geometric average annual return of the asset over a specified period. It smooths out short-term fluctuations and provides a long-term growth perspective.
Logarithmic Slope Coloring:
The slope of the log-scaled price is calculated and visualized with color gradients. Steeper upward slopes indicate stronger momentum and are highlighted with more intense colors. Downward slopes are shown in contrasting colors for easier identification of bearish trends.
オープンソーススクリプト
TradingViewの精神に則り、このスクリプトの作者はコードをオープンソースとして公開してくれました。トレーダーが内容を確認・検証できるようにという配慮です。作者に拍手を送りましょう!無料で利用できますが、コードの再公開はハウスルールに従う必要があります。
免責事項
この情報および投稿は、TradingViewが提供または推奨する金融、投資、トレード、その他のアドバイスや推奨を意図するものではなく、それらを構成するものでもありません。詳細は利用規約をご覧ください。
オープンソーススクリプト
TradingViewの精神に則り、このスクリプトの作者はコードをオープンソースとして公開してくれました。トレーダーが内容を確認・検証できるようにという配慮です。作者に拍手を送りましょう!無料で利用できますが、コードの再公開はハウスルールに従う必要があります。
免責事項
この情報および投稿は、TradingViewが提供または推奨する金融、投資、トレード、その他のアドバイスや推奨を意図するものではなく、それらを構成するものでもありません。詳細は利用規約をご覧ください。