PROTECTED SOURCE SCRIPT
更新済 TMA - Divergence Indicator
█ OVERVIEW
This indicator was inspired by Arty and Christy. I have taken what they teach and combined it into this amazing RSI Divergence Oscillator.
█ COMPONENTS
Here is a brief overview of the indicator:
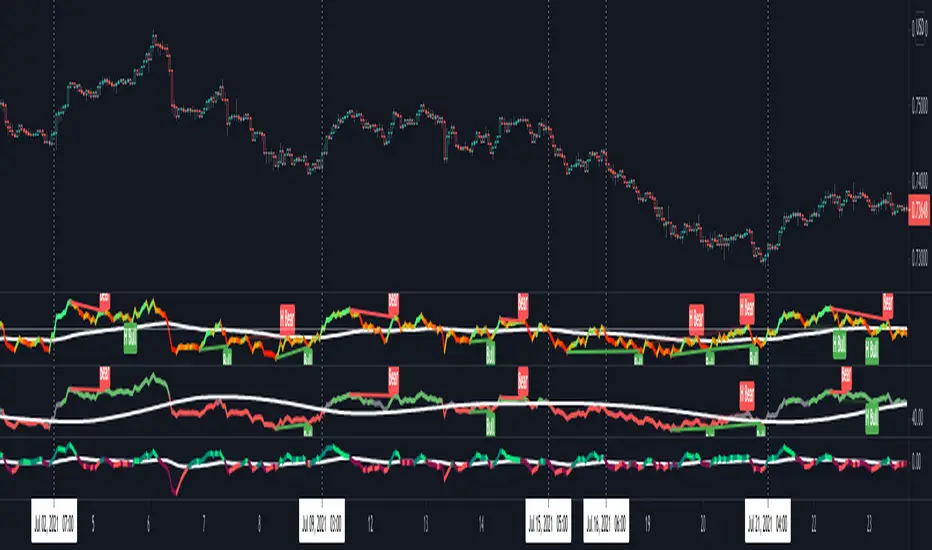
1 — RSI Divergence
Arty uses the RSI divergence as a tool to find entry points and possible reversals. He doesn't use the traditional overbought/oversold. He uses a 50 line. This indicator includes a 50 line and a floating 50 line.
The floating 50 line is a multi-timeframe smoothed moving average. Price is not linear, therefore, your 50 line shouldn't be either.
The RSI line is using a dynamic color algo that shows current control of the market as well as possible turning points in the market. Think of it as a momentum indicator inside your momentum indicator, pretty cool, huh?
2 — Smoothed RSI Divergence
The Smoothed RSI Divergence is a slower RSI with different calculations to smooth out the RSI line. This gives a different perspective of price action and more of a long term perspective of the trend. When crosses of the floating 50 line up with the traditional RSI crossing floating 50, these are amazing entries!
3 — Momentum Divergence
This is my baby. This one will take a little bit of time to master, (and I will be doing videos for you). But, once you master this, and combined with the other two, damn these entries get downright lethal!
This indicator was inspired by Arty and Christy. I have taken what they teach and combined it into this amazing RSI Divergence Oscillator.
█ COMPONENTS
Here is a brief overview of the indicator:
1 — RSI Divergence
Arty uses the RSI divergence as a tool to find entry points and possible reversals. He doesn't use the traditional overbought/oversold. He uses a 50 line. This indicator includes a 50 line and a floating 50 line.
The floating 50 line is a multi-timeframe smoothed moving average. Price is not linear, therefore, your 50 line shouldn't be either.
The RSI line is using a dynamic color algo that shows current control of the market as well as possible turning points in the market. Think of it as a momentum indicator inside your momentum indicator, pretty cool, huh?
2 — Smoothed RSI Divergence
The Smoothed RSI Divergence is a slower RSI with different calculations to smooth out the RSI line. This gives a different perspective of price action and more of a long term perspective of the trend. When crosses of the floating 50 line up with the traditional RSI crossing floating 50, these are amazing entries!
3 — Momentum Divergence
This is my baby. This one will take a little bit of time to master, (and I will be doing videos for you). But, once you master this, and combined with the other two, damn these entries get downright lethal!
リリースノート
Updated chart to show price actionリリースノート
Small fixリリースノート
Small code adjustmentsリリースノート
Minor fixes1 - Added extreme levels (OB/OS)
2 - Preview of alerts to come
リリースノート
Added Disclaimer1 — Added alerts for divergences
3 — Added alerts for floating 50 cross over and cross under
リリースノート
Small code tweak保護スクリプト
このスクリプトのソースコードは非公開で投稿されています。 しかし、無料かつ制限なしでご利用いただけます ― 詳細についてはこちらをご覧ください。
免責事項
これらの情報および投稿は、TradingViewが提供または保証する金融、投資、取引、またはその他の種類のアドバイスや推奨を意図したものではなく、またそのようなものでもありません。詳しくは利用規約をご覧ください。
保護スクリプト
このスクリプトのソースコードは非公開で投稿されています。 しかし、無料かつ制限なしでご利用いただけます ― 詳細についてはこちらをご覧ください。
免責事項
これらの情報および投稿は、TradingViewが提供または保証する金融、投資、取引、またはその他の種類のアドバイスや推奨を意図したものではなく、またそのようなものでもありません。詳しくは利用規約をご覧ください。