OPEN-SOURCE SCRIPT
更新済 Rational Qaudratic Kernel Elder Force Index
Introduction:
The Rational Quadratic Kernel Elder Force Index is a versatile and mathematically sophisticated technical indicator that enhances the traditional Elder Force Index (EFI) by applying a rational quadratic kernel smoothing technique. This advanced regression method is designed to provide traders with a more adaptive and accurate tool for measuring the strength behind price movements, incorporating the influence of volume. This indicator does not predict future price movements, but it offers a clearer view of market dynamics through its advanced smoothing mechanism.
Key Features:
Elder Force Index Foundation:
The core of this indicator is built on the Elder Force Index, a popular tool developed by Dr. Alexander Elder. The EFI is a momentum indicator that calculates the strength of price movements by combining both price change and volume.
Rational Quadratic Kernel Smoothing: The indicator incorporates a rational quadratic kernel for smoothing, providing traders with a more refined view of price action trends. This kernel is highly adjustable based on user inputs, allowing for flexible tuning to suit individual strategies.
Adaptive Time Frame Weighting:
Through the adjustable parameter Relative Weighting (r), traders can modify the influence of different time frames. Lower values give more weight to longer time frames, while higher values make the behavior resemble that of a Gaussian kernel.
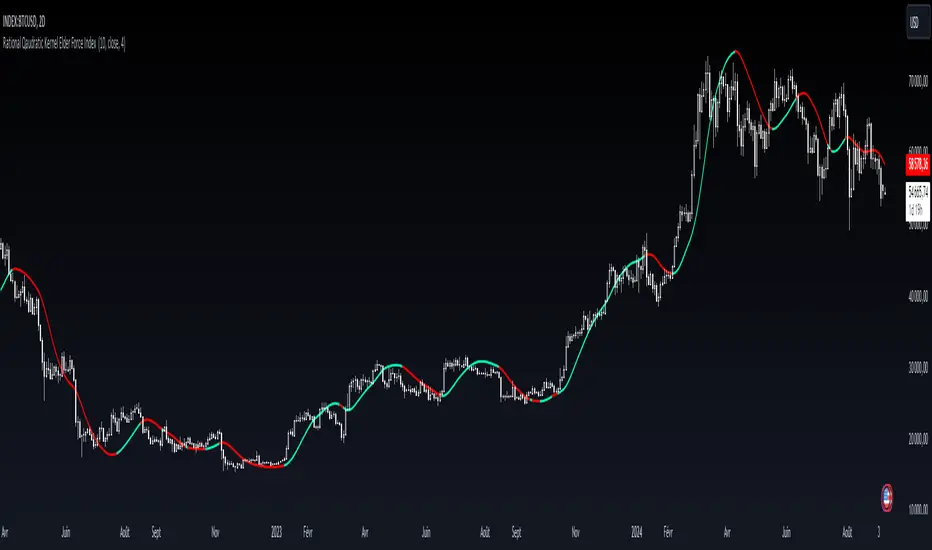
Dynamic Visualization:
The indicator visually displays the smoothed force index as a color-coded line. It dynamically changes color based on market conditions—green when the smoothed force index is positive and red when it is negative—providing a clear and easy-to-read signal for traders.
How It Works:
The Elder Force Index is calculated by multiplying the price change between two bars with the volume of the current bar.
A rational quadratic kernel regression is applied to this raw EFI data. The smoothing process provides a more stable and reliable signal by reducing noise, particularly in volatile markets.
The user-defined parameters, such as the length of the smoothing window and the relative weighting factor, allow traders to customize the indicator to suit their specific trading style or asset class.
User Inputs:
Length:
Sets the smoothing window for the kernel regression. A longer length results in more significant smoothing.
Relative Weighting (r):
Controls the influence of different time frames in the smoothing process. A smaller value emphasizes longer-term data, while a higher value makes it behave more like a traditional Gaussian kernel.
Source:
Select the price source (default is the closing price) for the calculations.
The Rational Quadratic Kernel Elder Force Index is a versatile and mathematically sophisticated technical indicator that enhances the traditional Elder Force Index (EFI) by applying a rational quadratic kernel smoothing technique. This advanced regression method is designed to provide traders with a more adaptive and accurate tool for measuring the strength behind price movements, incorporating the influence of volume. This indicator does not predict future price movements, but it offers a clearer view of market dynamics through its advanced smoothing mechanism.
Key Features:
Elder Force Index Foundation:
The core of this indicator is built on the Elder Force Index, a popular tool developed by Dr. Alexander Elder. The EFI is a momentum indicator that calculates the strength of price movements by combining both price change and volume.
Rational Quadratic Kernel Smoothing: The indicator incorporates a rational quadratic kernel for smoothing, providing traders with a more refined view of price action trends. This kernel is highly adjustable based on user inputs, allowing for flexible tuning to suit individual strategies.
Adaptive Time Frame Weighting:
Through the adjustable parameter Relative Weighting (r), traders can modify the influence of different time frames. Lower values give more weight to longer time frames, while higher values make the behavior resemble that of a Gaussian kernel.
Dynamic Visualization:
The indicator visually displays the smoothed force index as a color-coded line. It dynamically changes color based on market conditions—green when the smoothed force index is positive and red when it is negative—providing a clear and easy-to-read signal for traders.
How It Works:
The Elder Force Index is calculated by multiplying the price change between two bars with the volume of the current bar.
A rational quadratic kernel regression is applied to this raw EFI data. The smoothing process provides a more stable and reliable signal by reducing noise, particularly in volatile markets.
The user-defined parameters, such as the length of the smoothing window and the relative weighting factor, allow traders to customize the indicator to suit their specific trading style or asset class.
User Inputs:
Length:
Sets the smoothing window for the kernel regression. A longer length results in more significant smoothing.
Relative Weighting (r):
Controls the influence of different time frames in the smoothing process. A smaller value emphasizes longer-term data, while a higher value makes it behave more like a traditional Gaussian kernel.
Source:
Select the price source (default is the closing price) for the calculations.
リリースノート
removed the french comments that were uselessリリースノート
...リリースノート
...リリースノート
added watermark in code オープンソーススクリプト
TradingViewの精神に則り、このスクリプトの作者はコードをオープンソースとして公開してくれました。トレーダーが内容を確認・検証できるようにという配慮です。作者に拍手を送りましょう!無料で利用できますが、コードの再公開はハウスルールに従う必要があります。
🚀 Elevate your edge with institutional-grade indicators & full trading systems.
🔗 Access tools: linktr.ee/0xKazo
🔗 Access tools: linktr.ee/0xKazo
免責事項
この情報および投稿は、TradingViewが提供または推奨する金融、投資、トレード、その他のアドバイスや推奨を意図するものではなく、それらを構成するものでもありません。詳細は利用規約をご覧ください。
オープンソーススクリプト
TradingViewの精神に則り、このスクリプトの作者はコードをオープンソースとして公開してくれました。トレーダーが内容を確認・検証できるようにという配慮です。作者に拍手を送りましょう!無料で利用できますが、コードの再公開はハウスルールに従う必要があります。
🚀 Elevate your edge with institutional-grade indicators & full trading systems.
🔗 Access tools: linktr.ee/0xKazo
🔗 Access tools: linktr.ee/0xKazo
免責事項
この情報および投稿は、TradingViewが提供または推奨する金融、投資、トレード、その他のアドバイスや推奨を意図するものではなく、それらを構成するものでもありません。詳細は利用規約をご覧ください。