OPEN-SOURCE SCRIPT
更新済 Ichimoku Bars
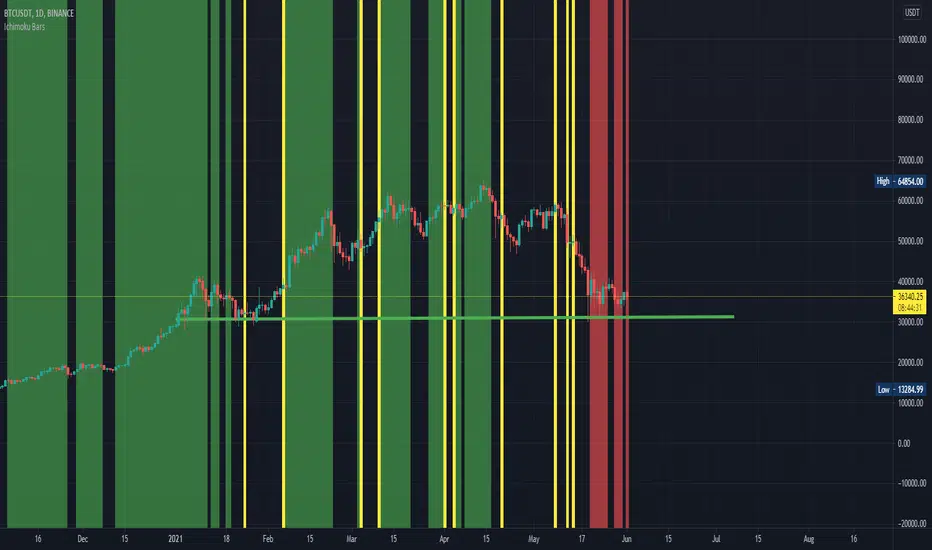
This script follows off the principles of the Ichimoku Cloud indicator. The green zones display optimal time to buy according to the Ichimoku model. The red zones show optimal time to sell according to the Ichimoku model inverse. The yellow zones show where the conversion line meets the base line (potential up or down movement at this point). Feel free to contact me to fix any problems or add additional info.
リリースノート
Update 1: Fixed yellow bars to show all locations where conversion line meets the base line. リリースノート
Added the ability to turn On/Off the Ichimoku Cloud indicator on top of the Ichimoku Bars. This feature is useful for peoplpe who use the free version of TradingView where the number of indicators to have on at once is limited. リリースノート
Added Ichimoku Cloud category. Fixed fill bug. リリースノート
Updated color format to the newer version. Console should now show no depreciating errors. リリースノート
Cleaned up the code and updated to version 5!オープンソーススクリプト
TradingViewの精神に則り、このスクリプトの作者はコードをオープンソースとして公開してくれました。トレーダーが内容を確認・検証できるようにという配慮です。作者に拍手を送りましょう!無料で利用できますが、コードの再公開はハウスルールに従う必要があります。
免責事項
この情報および投稿は、TradingViewが提供または推奨する金融、投資、トレード、その他のアドバイスや推奨を意図するものではなく、それらを構成するものでもありません。詳細は利用規約をご覧ください。
オープンソーススクリプト
TradingViewの精神に則り、このスクリプトの作者はコードをオープンソースとして公開してくれました。トレーダーが内容を確認・検証できるようにという配慮です。作者に拍手を送りましょう!無料で利用できますが、コードの再公開はハウスルールに従う必要があります。
免責事項
この情報および投稿は、TradingViewが提供または推奨する金融、投資、トレード、その他のアドバイスや推奨を意図するものではなく、それらを構成するものでもありません。詳細は利用規約をご覧ください。