OPEN-SOURCE SCRIPT
Lawyers Trend Pro Strategy
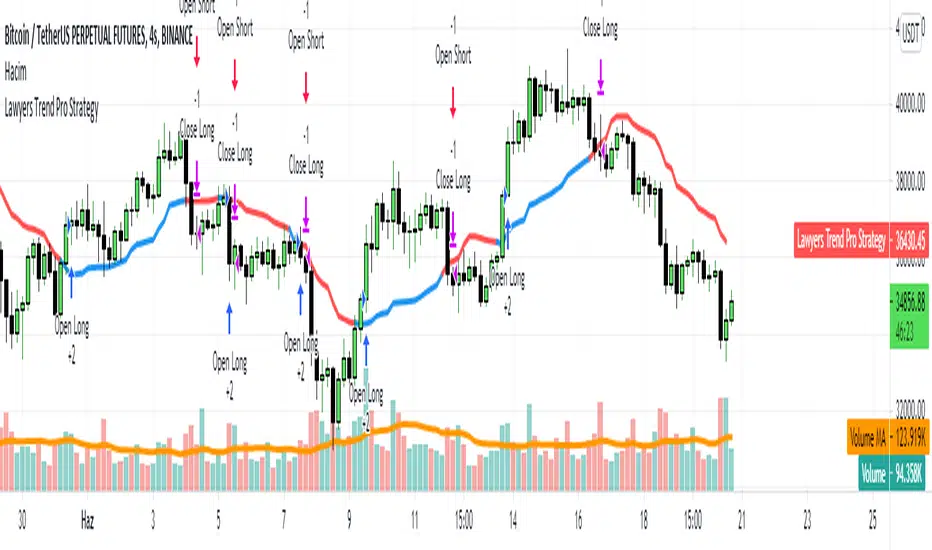
This indicator basilcy has 1 line
This indicator basicly using 2 different calculations average.
And you can see this average as line on this script.
This line has 2 functions
1. Buy and Sell Strategy
-İf the line colored BLUE this means you can BUY (Long)
-İf the line colored RED this means you can SELL (Short)

As you can see the picture you can buy-sell and long-short with this line
2. Support and Resistance Function
You can use the line as resistance and support.
You can see when you can LONG and when you can SHORT with this strategy.
This indicator basicly using 2 different calculations average.
And you can see this average as line on this script.
This line has 2 functions
1. Buy and Sell Strategy
-İf the line colored BLUE this means you can BUY (Long)
-İf the line colored RED this means you can SELL (Short)
As you can see the picture you can buy-sell and long-short with this line
2. Support and Resistance Function
You can use the line as resistance and support.
You can see when you can LONG and when you can SHORT with this strategy.
オープンソーススクリプト
TradingViewの精神に則り、このスクリプトの作者はコードをオープンソースとして公開してくれました。トレーダーが内容を確認・検証できるようにという配慮です。作者に拍手を送りましょう!無料で利用できますが、コードの再公開はハウスルールに従う必要があります。
免責事項
この情報および投稿は、TradingViewが提供または推奨する金融、投資、トレード、その他のアドバイスや推奨を意図するものではなく、それらを構成するものでもありません。詳細は利用規約をご覧ください。
オープンソーススクリプト
TradingViewの精神に則り、このスクリプトの作者はコードをオープンソースとして公開してくれました。トレーダーが内容を確認・検証できるようにという配慮です。作者に拍手を送りましょう!無料で利用できますが、コードの再公開はハウスルールに従う必要があります。
免責事項
この情報および投稿は、TradingViewが提供または推奨する金融、投資、トレード、その他のアドバイスや推奨を意図するものではなく、それらを構成するものでもありません。詳細は利用規約をご覧ください。