INVITE-ONLY SCRIPT
Power Law Global Liquidity Price Model & Oscillator
Description:
This Pine Script implements a predictive Bitcoin (BTC) price model derived from an observed power-law relationship between BTC price and Global Liquidity (specifically Global M2).
To clarify, the indicator doesn't show M2 directly as many indicators do, but uses an empirical observed relationship between BTC price and M2. This is an important difference from other Global Liquidity indicators and makes it very useful because it allows for making predictions on the future of Bitcoin price.
The model is based on the relationship BTC ~ GL^9.3, where GL represents Global M2, and the best correlation is achieved with an 85-period lead in GL, making it a leading indicator for BTC price movements. The observed correlation is higher than 0.92, giving high confidence in the model's validity. The 85-day lead was chosen by calculating the predictive rate of the model (how many times a positive/negative return in the model correlates with the price) with a given lead. The relationship between a chosen delay and predictive power has a maximum at 85 days.
Features:
BTC Price Model:
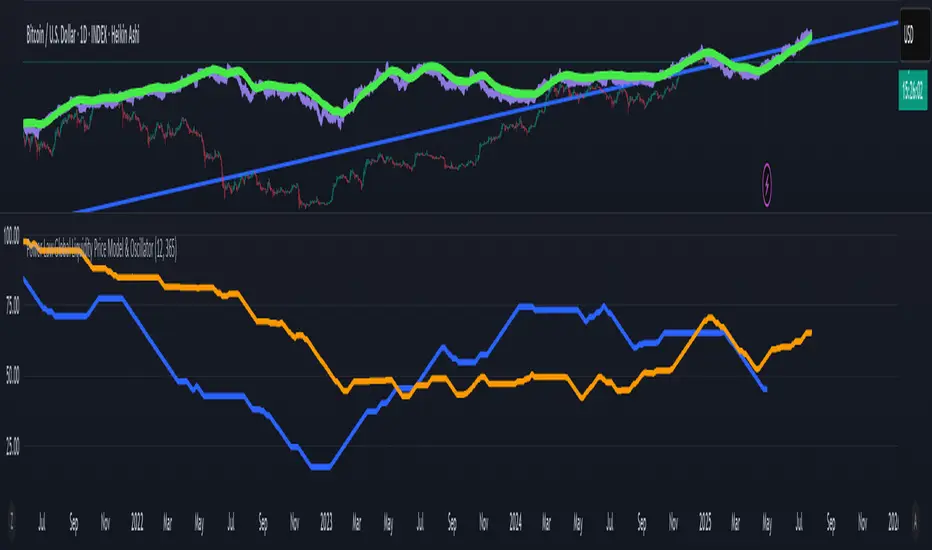
Calculates a BTC price model using the power-law relationship (BTC ~ GL^9.3) with an 85-period lead in Global Liquidity data.
The model is superimposed on the chart using forced overlay for clear visualization of the predicted BTC price trend relative to actual price.
Directional Oscillator:
Displayed in a lower panel, the oscillator compares the structural similarity between the actual BTC price and the GL-based price model.
Computes the win rate of the averaged BTC price (over a 1-year period) versus the price model to highlight structural alignment.
Projects future oscillator values based on the 85-period lead in the GL model, providing insight into potential price direction.
This feature is also very unique, and it is not present in most Global Liquidity indicators. The reason to choose the win rate is that this parameter doesn't depend on a precise scaling
between the BTC price and GL. This allows for better identification of changes in features between the 2 time series (for example, a downturn, a run up, peaks, bottoms, and similar).
Purpose:
This script serves as a predictive tool for traders and analysts by leveraging the leading relationship between Global Liquidity and BTC price. The overlay model and oscillator provide both a visual and quantitative framework to anticipate BTC price trends and assess structural alignment with global economic indicators.
The indicator allows for early identification of bottoms, peaks, and possible local bull or bear runs.
Usage Notes:
This indicator works best when used with the "All Time History" BTCUSD index.
The 85-period lead in GL allows for forward-looking projections, making this tool suitable for strategic planning.
The oscillator aids in confirming the structural validity of the model, enhancing confidence in its projections.
This Pine Script implements a predictive Bitcoin (BTC) price model derived from an observed power-law relationship between BTC price and Global Liquidity (specifically Global M2).
To clarify, the indicator doesn't show M2 directly as many indicators do, but uses an empirical observed relationship between BTC price and M2. This is an important difference from other Global Liquidity indicators and makes it very useful because it allows for making predictions on the future of Bitcoin price.
The model is based on the relationship BTC ~ GL^9.3, where GL represents Global M2, and the best correlation is achieved with an 85-period lead in GL, making it a leading indicator for BTC price movements. The observed correlation is higher than 0.92, giving high confidence in the model's validity. The 85-day lead was chosen by calculating the predictive rate of the model (how many times a positive/negative return in the model correlates with the price) with a given lead. The relationship between a chosen delay and predictive power has a maximum at 85 days.
Features:
BTC Price Model:
Calculates a BTC price model using the power-law relationship (BTC ~ GL^9.3) with an 85-period lead in Global Liquidity data.
The model is superimposed on the chart using forced overlay for clear visualization of the predicted BTC price trend relative to actual price.
Directional Oscillator:
Displayed in a lower panel, the oscillator compares the structural similarity between the actual BTC price and the GL-based price model.
Computes the win rate of the averaged BTC price (over a 1-year period) versus the price model to highlight structural alignment.
Projects future oscillator values based on the 85-period lead in the GL model, providing insight into potential price direction.
This feature is also very unique, and it is not present in most Global Liquidity indicators. The reason to choose the win rate is that this parameter doesn't depend on a precise scaling
between the BTC price and GL. This allows for better identification of changes in features between the 2 time series (for example, a downturn, a run up, peaks, bottoms, and similar).
Purpose:
This script serves as a predictive tool for traders and analysts by leveraging the leading relationship between Global Liquidity and BTC price. The overlay model and oscillator provide both a visual and quantitative framework to anticipate BTC price trends and assess structural alignment with global economic indicators.
The indicator allows for early identification of bottoms, peaks, and possible local bull or bear runs.
Usage Notes:
This indicator works best when used with the "All Time History" BTCUSD index.
The 85-period lead in GL allows for forward-looking projections, making this tool suitable for strategic planning.
The oscillator aids in confirming the structural validity of the model, enhancing confidence in its projections.
招待専用スクリプト
このスクリプトは作者が承認したユーザーのみアクセス可能です。使用するにはアクセス申請をして許可を得る必要があります。通常は支払い後に承認されます。詳細は下記の作者の指示に従うか、Quantonomyfundに直接お問い合わせください。
TradingViewは、作者を完全に信頼し、スクリプトの動作を理解していない限り、有料スクリプトの購入・使用を推奨しません。コミュニティスクリプトには無料のオープンソースの代替が多数あります。
作者の指示
Contact the author for instructions on how to access the indicator.
免責事項
この情報および投稿は、TradingViewが提供または推奨する金融、投資、トレード、その他のアドバイスや推奨を意図するものではなく、それらを構成するものでもありません。詳細は利用規約をご覧ください。