OPEN-SOURCE SCRIPT
更新済 Burner Volume Candles
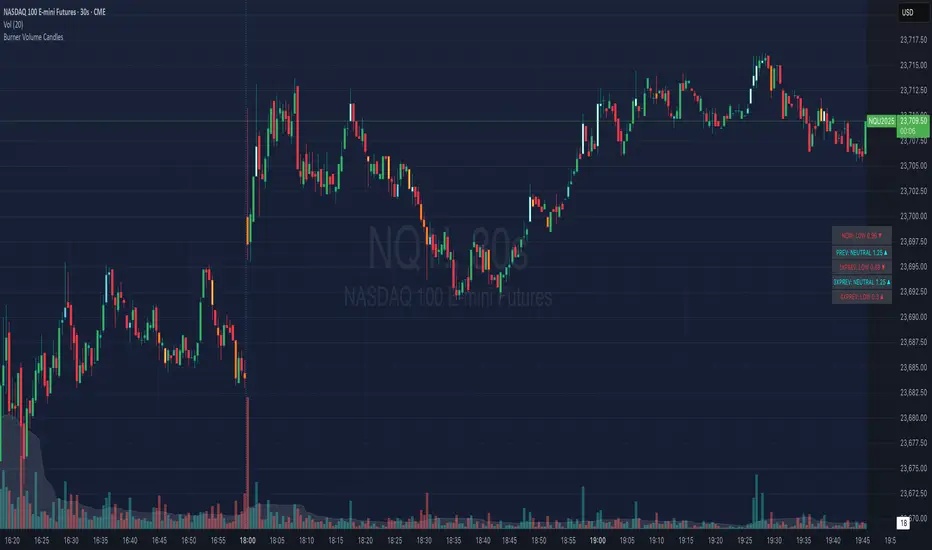
Visually see different candle colors based on volume relative to the look back period (default is last 20 candles).
This allows you to see if a current candle print is standard, high, or extreme sell/buy volume relative to the look back period.
This has been primarily used on the 30s timeframe on NQ.
It is also advised to take the NY open candle volume with a grain of salt as that is typically the extreme volume so it doesn't make this indicator as useful when it comes to those candles.
リリースノート
Visually see different candle colors based on volume relative to the look back period (default is last 20 candles).This allows you to see if a current candle print is standard, high, or extreme sell/buy volume relative to the look back period.
This has been primarily used on the 30s timeframe on NQ.
It is also advised to take the NY open candle volume with a grain of salt as that is typically the extreme volume so it doesn't make this indicator as useful when it comes to those candles.
オープンソーススクリプト
TradingViewの精神に則り、このスクリプトの作者はコードをオープンソースとして公開してくれました。トレーダーが内容を確認・検証できるようにという配慮です。作者に拍手を送りましょう!無料で利用できますが、コードの再公開はハウスルールに従う必要があります。
免責事項
この情報および投稿は、TradingViewが提供または推奨する金融、投資、トレード、その他のアドバイスや推奨を意図するものではなく、それらを構成するものでもありません。詳細は利用規約をご覧ください。
オープンソーススクリプト
TradingViewの精神に則り、このスクリプトの作者はコードをオープンソースとして公開してくれました。トレーダーが内容を確認・検証できるようにという配慮です。作者に拍手を送りましょう!無料で利用できますが、コードの再公開はハウスルールに従う必要があります。
免責事項
この情報および投稿は、TradingViewが提供または推奨する金融、投資、トレード、その他のアドバイスや推奨を意図するものではなく、それらを構成するものでもありません。詳細は利用規約をご覧ください。