INVITE-ONLY SCRIPT
CMR Goldfish

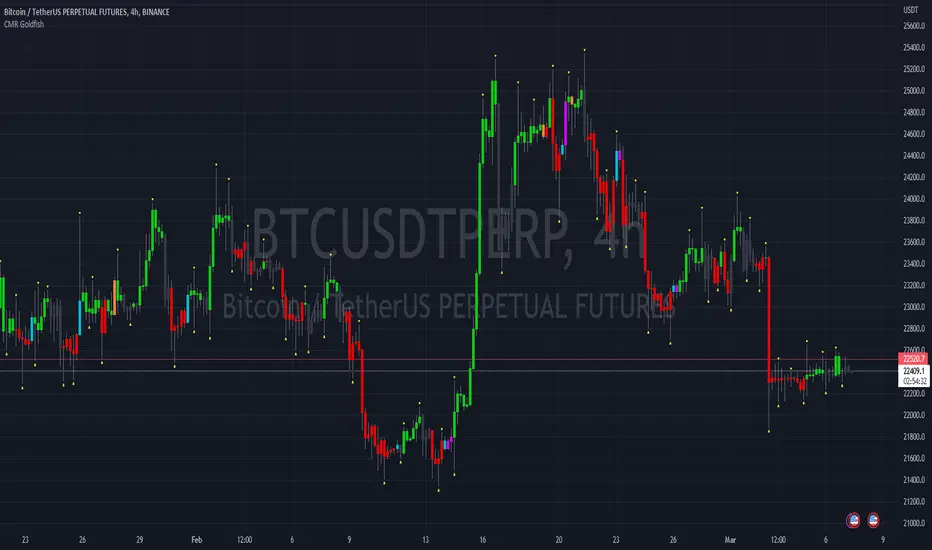
The Goldfish indicator gives you a view into how the market is moving and how money is flowing into or out of the market. It color codes the candlesticks with bullish , bearish and hedged colors.
Looking at multiple timeframes the indicator gives insight into witch direction the market is moving and helps indicate good entry and exit points.
The indicator works on all timeframes and markets. Within the setting the Indicator can be fine tuned to the market you are watching.
The Indicator paints the candles. You need to either hide the regular candles or bring the indicators visual order to the front.
Goldfish Indicator Overview
Green = bullish
Red = bearish
Black = neutral
Purple = hedged, this means we have bullish and bearish
Blue = hedged, with possible long entry
Orange = hedged with possible short entry
Trade
Enter a Long trade on a blue or first geen candle
Enter a Short on an orange or first red candle
Hedge in pink
No trades on black
招待専用スクリプト
こちらのスクリプトにアクセスできるのは投稿者が承認したユーザーだけです。投稿者にリクエストして使用許可を得る必要があります。通常の場合、支払い後に許可されます。詳細については、以下、作者の指示をお読みになるか、IDSalgoに直接ご連絡ください。
このプライベートの招待専用スクリプトは、まだスクリプトモデレーターによるレビューを受けていません。ハウスルールに準拠しているかについては不明です。 スクリプトの機能を理解し、その作者を全面的に信頼しているのでなければ、お金を支払ってまでそのスクリプトを利用することをTradingViewとしては「非推奨」としています。コミュニティスクリプトの中で、その代わりとなる無料かつオープンソースのスクリプトを見つけられる可能性もあります。
作者の指示
Please visit our homepage to get access to the Indicator
免責事項
これらの情報および投稿は、TradingViewが提供または保証する金融、投資、取引、またはその他の種類のアドバイスや推奨を意図したものではなく、またそのようなものでもありません。詳しくは利用規約をご覧ください。