OPEN-SOURCE SCRIPT
更新済 LEAN Change
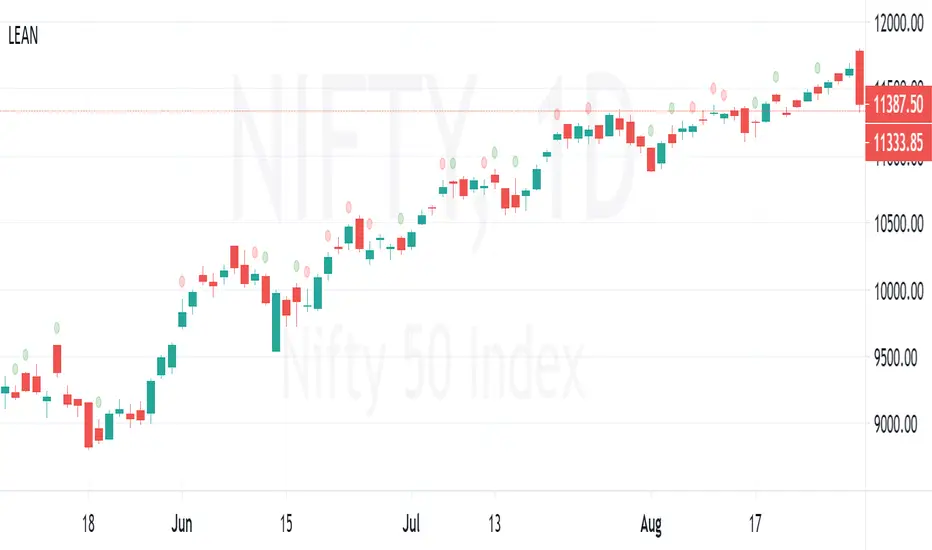
LEAN = Difference between %K and %D values of stochastic
Change in LEAN is plotted over the bar as a "Circle"
RED Circle => LEAN is decreased from previous value
GREEN Circle => LEAN is increased from previous value
Value of LEAN can be viewed at data window.
Change in LEAN is plotted over the bar as a "Circle"
RED Circle => LEAN is decreased from previous value
GREEN Circle => LEAN is increased from previous value
Value of LEAN can be viewed at data window.
リリースノート
Added option to view the change in Lean only if it moved in adverse direction of price (change in Lean is positive on Red bar or change in Lean is negative on Green bar)オープンソーススクリプト
TradingViewの精神に則り、このスクリプトの作者はコードをオープンソースとして公開してくれました。トレーダーが内容を確認・検証できるようにという配慮です。作者に拍手を送りましょう!無料で利用できますが、コードの再公開はハウスルールに従う必要があります。
免責事項
この情報および投稿は、TradingViewが提供または推奨する金融、投資、トレード、その他のアドバイスや推奨を意図するものではなく、それらを構成するものでもありません。詳細は利用規約をご覧ください。
オープンソーススクリプト
TradingViewの精神に則り、このスクリプトの作者はコードをオープンソースとして公開してくれました。トレーダーが内容を確認・検証できるようにという配慮です。作者に拍手を送りましょう!無料で利用できますが、コードの再公開はハウスルールに従う必要があります。
免責事項
この情報および投稿は、TradingViewが提供または推奨する金融、投資、トレード、その他のアドバイスや推奨を意図するものではなく、それらを構成するものでもありません。詳細は利用規約をご覧ください。