OPEN-SOURCE SCRIPT
更新済 Overnight vs Intra-day Performance

█ STRATEGY OVERVIEW
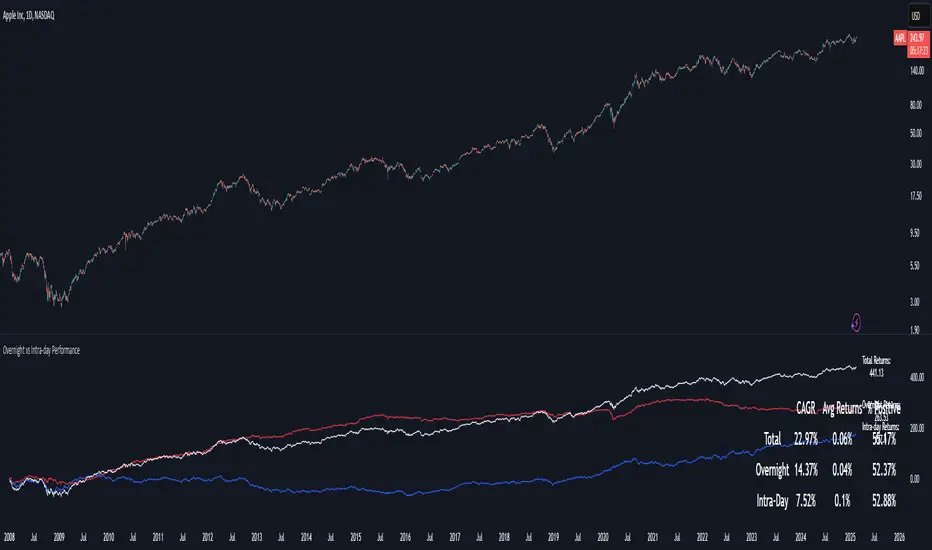
The "Overnight vs Intra-day Performance" indicator quantifies price behaviour differences between trading hours and overnight periods. It calculates cumulative returns, compound growth rates, and visualizes performance components across user-defined time windows. Designed for analytical use, it helps identify whether returns are primarily generated during market hours or overnight sessions.
█ USAGE
Use this indicator on Stocks and ETFs to visualise and compare intra-day vs overnight performance
█ KEY FEATURES
█ VISUALIZATION SYSTEM
1. Time-Series
2. Summary Table
3. Price Chart Labels
█ PURPOSE
█ IDEAL USERS
1. Portfolio Managers
2. Quantitative Researchers
3. Market Microstructure Analysts
4. Day Traders
The "Overnight vs Intra-day Performance" indicator quantifies price behaviour differences between trading hours and overnight periods. It calculates cumulative returns, compound growth rates, and visualizes performance components across user-defined time windows. Designed for analytical use, it helps identify whether returns are primarily generated during market hours or overnight sessions.
█ USAGE
Use this indicator on Stocks and ETFs to visualise and compare intra-day vs overnight performance
█ KEY FEATURES
- Return Segmentation: Separates total returns into overnight (close-to-open) and intraday (open-to-close) components
Growth Tracking: Shows simple cumulative returns and compound annual growth rates (CAGR)
█ VISUALIZATION SYSTEM
1. Time-Series
- Overnight Returns (Red)
- Intraday Returns (Blue)
- Total Returns (White)
2. Summary Table
- Displays CAGR
3. Price Chart Labels
- Floating annotations showing absolute returns and CAGR
- Color-coded to match plot series
█ PURPOSE
- Quantify market behaviour disparities between active trading sessions and overnight positioning
- Provide institutional-grade attribution analysis for returns generation
- Enable tactical adjustment of trading schedules based on historical performance patterns
- Serve as foundational research for session-specific trading strategies
█ IDEAL USERS
1. Portfolio Managers
- Analyse overnight risk exposure across holdings
- Optimize execution timing based on return distributions
2. Quantitative Researchers
- Study market microstructure through time-segmented returns
- Develop alpha models leveraging session-specific anomalies
3. Market Microstructure Analysts
- Identify liquidity patterns in overnight vs daytime sessions
- Research ETF premium/discount mechanics
4. Day Traders
- Align trading hours with highest probability return windows
- Avoid overnight gaps through informed position sizing
リリースノート
Added average returns and percent positiveオープンソーススクリプト
TradingViewの精神に則り、このスクリプトの作者はコードをオープンソースとして公開してくれました。トレーダーが内容を確認・検証できるようにという配慮です。作者に拍手を送りましょう!無料で利用できますが、コードの再公開はハウスルールに従う必要があります。
免責事項
この情報および投稿は、TradingViewが提供または推奨する金融、投資、トレード、その他のアドバイスや推奨を意図するものではなく、それらを構成するものでもありません。詳細は利用規約をご覧ください。
オープンソーススクリプト
TradingViewの精神に則り、このスクリプトの作者はコードをオープンソースとして公開してくれました。トレーダーが内容を確認・検証できるようにという配慮です。作者に拍手を送りましょう!無料で利用できますが、コードの再公開はハウスルールに従う必要があります。
免責事項
この情報および投稿は、TradingViewが提供または推奨する金融、投資、トレード、その他のアドバイスや推奨を意図するものではなく、それらを構成するものでもありません。詳細は利用規約をご覧ください。