OPEN-SOURCE SCRIPT
Weekly Manipulation
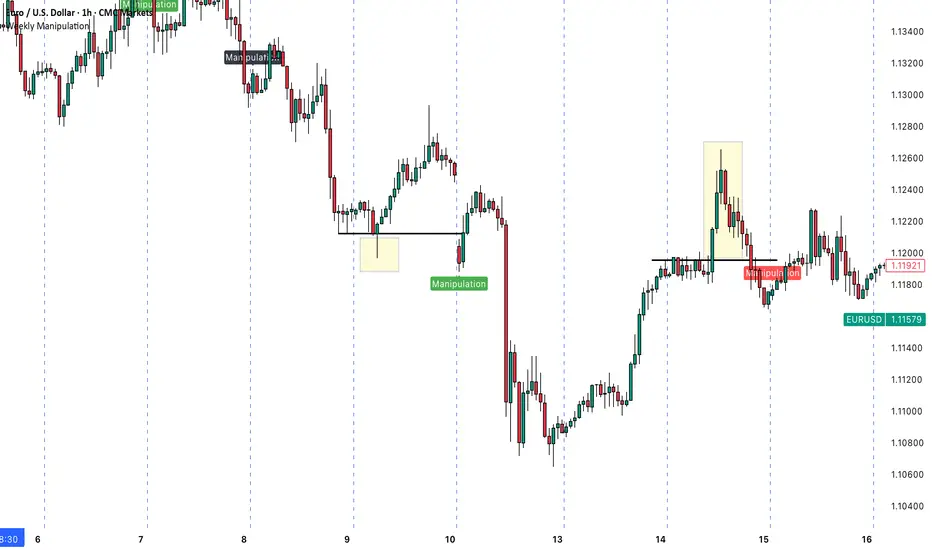
Understanding the "Weekly Manipulation" Indicator
The "Weekly Manipulation" indicator is a powerful tool designed to identify false breakouts in the market—moments. Let me explain how it works in simple terms.
What This Indicator Detects
This indicator spots two specific market behaviors that often indicate manipulation:
1. Single-Day Manipulation (Red/Green Labels)
This occurs when price briefly breaks through a significant daily level but fails to maintain the momentum:
Bearish Manipulation (Red): Price pushes above the previous day's high, but then reverses and closes below that high.
Bullish Manipulation (Green): Price drops below the previous day's low), but then reverses and closes above that low.
2. Two-Day Manipulation (Black Labels)
This is a more complex version of the same pattern, but occurring over a 2-day period. These signals can indicate even stronger manipulation attempts and potentially more powerful reversals.
Why This Matters for Your Trading
By identifying these patterns, you can:
- Avoid getting caught in false breakouts
- Find potential entry points after the manipulation is complete
- Understand when market action might not be genuine price discovery
How to Use This Indicator
1. Look for Red Markers: These appear when price has attempted to break higher but failed. This often suggests bearish potential going forward.
2. Look for Green Markers: These appear when price has attempted to break lower but failed. This often suggests bullish potential going forward.
3. Pay Attention to Black Markers: These 2-day patterns can signal stronger reversals and might be worth giving extra weight in your analysis.
The indicator labels these patterns clearly as "Manipulation" right on your chart, giving you an immediate visual cue when these potential setups occur.
オープンソーススクリプト
TradingViewの精神に則り、このスクリプトの作者はコードをオープンソースとして公開してくれました。トレーダーが内容を確認・検証できるようにという配慮です。作者に拍手を送りましょう!無料で利用できますが、コードの再公開はハウスルールに従う必要があります。
免責事項
この情報および投稿は、TradingViewが提供または推奨する金融、投資、トレード、その他のアドバイスや推奨を意図するものではなく、それらを構成するものでもありません。詳細は利用規約をご覧ください。
オープンソーススクリプト
TradingViewの精神に則り、このスクリプトの作者はコードをオープンソースとして公開してくれました。トレーダーが内容を確認・検証できるようにという配慮です。作者に拍手を送りましょう!無料で利用できますが、コードの再公開はハウスルールに従う必要があります。
免責事項
この情報および投稿は、TradingViewが提供または推奨する金融、投資、トレード、その他のアドバイスや推奨を意図するものではなく、それらを構成するものでもありません。詳細は利用規約をご覧ください。