OPEN-SOURCE SCRIPT
更新済 [NLR] - SweetSpot Zones
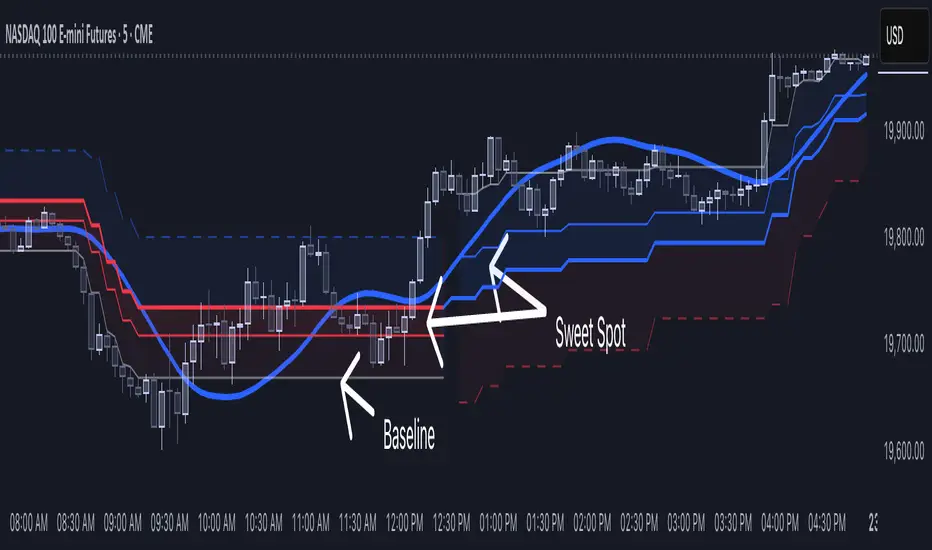
The Sweet Spot Zone helps you find the best spots to enter a trade, inspired by the "Follow Line Indicator" by Dreadblitz (big thanks to him!). It draws a colored zone on your chart to show ideal entry points, with a Base Point to keep you on track.
What It Does
How to Use It
Settings
Credits
Inspired by the "Follow Line Indicator" by Dreadblitz—check out his work for more great ideas!
What It Does
- Blue Zone: Uptrend—buy when the price dips into the zone.
- Red Zone: Downtrend—sell or short when the price climbs into the zone.
- Base Point: A gray line showing the key level the zone is built on.
How to Use It
- Look for the colored zone:
- Blue: Buy if the price dips into the zone but stays above the Base Point.
- Red: Sell/short if the price climbs into the zone but stays below the Base Point. - Important: Avoid entering trade beyond base point - you might see low returns and face big drawdowns.
- Confirm with other signals (like RSI/MACD) before entering.
Settings
- ATR Length (10): How far back it looks to calculate price movement.
- ATR Multiplier (2.5): How wide the zone is.
- Error Margin (5.0): Keeps the zone steady during small price wiggles.
- Uptrend/Downtrend Colors: Change the zone colors if you’d like!
Credits
Inspired by the "Follow Line Indicator" by Dreadblitz—check out his work for more great ideas!
リリースノート
Added other side zone to show possible area where price action may goオープンソーススクリプト
TradingViewの精神に則り、このスクリプトの作者はコードをオープンソースとして公開してくれました。トレーダーが内容を確認・検証できるようにという配慮です。作者に拍手を送りましょう!無料で利用できますが、コードの再公開はハウスルールに従う必要があります。
免責事項
この情報および投稿は、TradingViewが提供または推奨する金融、投資、トレード、その他のアドバイスや推奨を意図するものではなく、それらを構成するものでもありません。詳細は利用規約をご覧ください。
オープンソーススクリプト
TradingViewの精神に則り、このスクリプトの作者はコードをオープンソースとして公開してくれました。トレーダーが内容を確認・検証できるようにという配慮です。作者に拍手を送りましょう!無料で利用できますが、コードの再公開はハウスルールに従う必要があります。
免責事項
この情報および投稿は、TradingViewが提供または推奨する金融、投資、トレード、その他のアドバイスや推奨を意図するものではなく、それらを構成するものでもありません。詳細は利用規約をご覧ください。