OPEN-SOURCE SCRIPT
Whalemap [BigBeluga]

The Whalemap indicator aims to spot big buying and selling activity represented as big orders for a possible bottom or top formation on the chart.
🔶 CALCULATION
The indicator uses volume to spot big volume activity represented as big orders in the market.
Pine Script®
When volume exceeds its own threshold, it is a sign that volume is exceeding its normal value and is considered as a "Whale order" or "Whale activity," which is then plotted on the chart as circles.
🔶 DETAILS

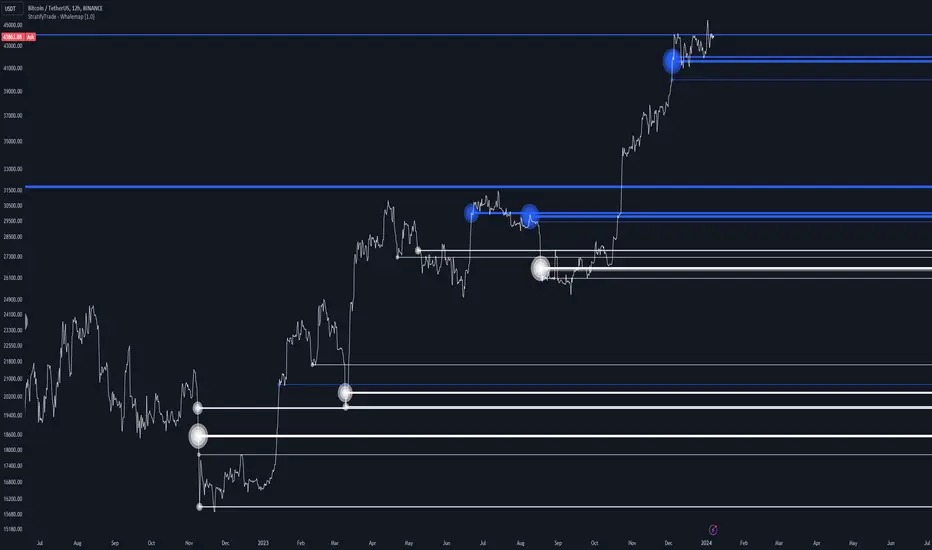
The indicator plots Bubbles on the chart with different sizes indicating the buying or selling activity. The bigger the circle, the more impact it will have on the market.
On each circle is also plotted a line, and its own weight is also determined by the strength of its own circle; the bigger the circle, the bigger the line.

Old buying/selling activity can also be used for future support and resistance to spot interesting areas.
The more price enters old buying/selling activity and starts producing orders of the same direction, it might be an interesting point to take a closer look.
🔶 EXAMPLES


The chart above is showing us price reacting to big orders, finding good bottoms in price and good tops in confluence with old activity.
🔶 SETTINGS
Users will have the options to:
🔶 CALCULATION
The indicator uses volume to spot big volume activity represented as big orders in the market.
for i = 0 to len - 1
blV.vol += (close > close[i + 1] ? volume : 0)
brV.vol += (close < close[i + 1] ? volume : 0)
When volume exceeds its own threshold, it is a sign that volume is exceeding its normal value and is considered as a "Whale order" or "Whale activity," which is then plotted on the chart as circles.
🔶 DETAILS
The indicator plots Bubbles on the chart with different sizes indicating the buying or selling activity. The bigger the circle, the more impact it will have on the market.
On each circle is also plotted a line, and its own weight is also determined by the strength of its own circle; the bigger the circle, the bigger the line.
Old buying/selling activity can also be used for future support and resistance to spot interesting areas.
The more price enters old buying/selling activity and starts producing orders of the same direction, it might be an interesting point to take a closer look.
🔶 EXAMPLES
The chart above is showing us price reacting to big orders, finding good bottoms in price and good tops in confluence with old activity.
🔶 SETTINGS
Users will have the options to:
- Filter options to adjust buying and selling sensitivity.
- Display/Hide Lines
- Display/Hide Bubbles
- Choose which orders to display (from smallest to biggest)
オープンソーススクリプト
TradingViewの精神に則り、このスクリプトの作者はコードをオープンソースとして公開してくれました。トレーダーが内容を確認・検証できるようにという配慮です。作者に拍手を送りましょう!無料で利用できますが、コードの再公開はハウスルールに従う必要があります。
🔵Gain access to our powerful tools : bigbeluga.com/tv
🔵Join our free discord for updates : bigbeluga.com/discord
All scripts & content provided by BigBeluga are for informational & educational purposes only.
🔵Join our free discord for updates : bigbeluga.com/discord
All scripts & content provided by BigBeluga are for informational & educational purposes only.
免責事項
この情報および投稿は、TradingViewが提供または推奨する金融、投資、トレード、その他のアドバイスや推奨を意図するものではなく、それらを構成するものでもありません。詳細は利用規約をご覧ください。