OPEN-SOURCE SCRIPT
更新済 Low-High RSI
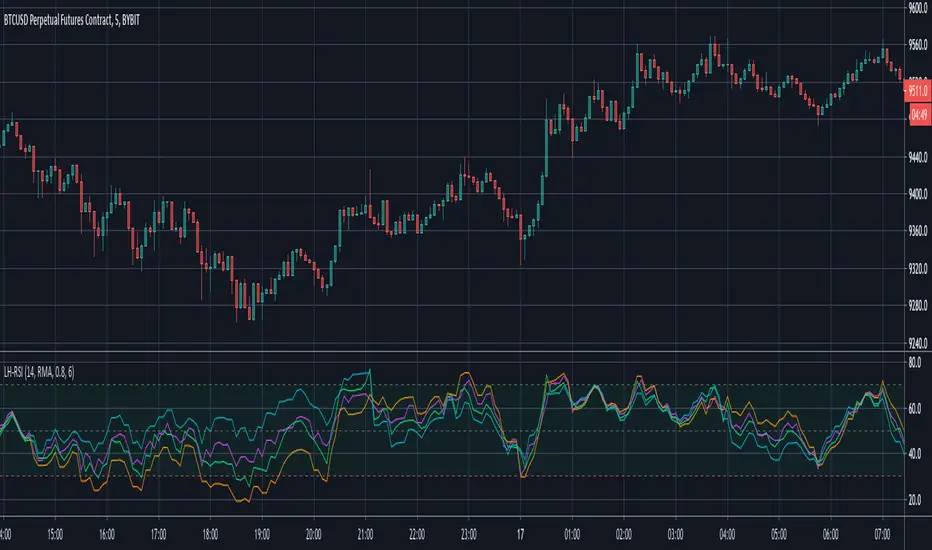
It is an RSI indicator with 3 lines (or 4 if you enable the original RSI in settings):
You can also select different moving averages for RSI calculation. (The default is the original RMA)
This indicator is useful for e.g. to filter out original RSI's false signals by waiting both low and high lines to confirm. Or you can use it as an earlier exit indicator.
Please write a comment if you find another usage of it.
- The lime is calculated from high
- The fuchsia is calculated from low
- The orange one is calcuated form both high and low, by calculating RSI's up from high and down from low
You can also select different moving averages for RSI calculation. (The default is the original RMA)
This indicator is useful for e.g. to filter out original RSI's false signals by waiting both low and high lines to confirm. Or you can use it as an earlier exit indicator.
Please write a comment if you find another usage of it.
リリースノート
Added RSI HL to the linesオープンソーススクリプト
TradingViewの精神に則り、このスクリプトの作者はコードをオープンソースとして公開してくれました。トレーダーが内容を確認・検証できるようにという配慮です。作者に拍手を送りましょう!無料で利用できますが、コードの再公開はハウスルールに従う必要があります。
免責事項
この情報および投稿は、TradingViewが提供または推奨する金融、投資、トレード、その他のアドバイスや推奨を意図するものではなく、それらを構成するものでもありません。詳細は利用規約をご覧ください。
オープンソーススクリプト
TradingViewの精神に則り、このスクリプトの作者はコードをオープンソースとして公開してくれました。トレーダーが内容を確認・検証できるようにという配慮です。作者に拍手を送りましょう!無料で利用できますが、コードの再公開はハウスルールに従う必要があります。
免責事項
この情報および投稿は、TradingViewが提供または推奨する金融、投資、トレード、その他のアドバイスや推奨を意図するものではなく、それらを構成するものでもありません。詳細は利用規約をご覧ください。