OPEN-SOURCE SCRIPT
更新済 Linear Regression Forecast
Description:
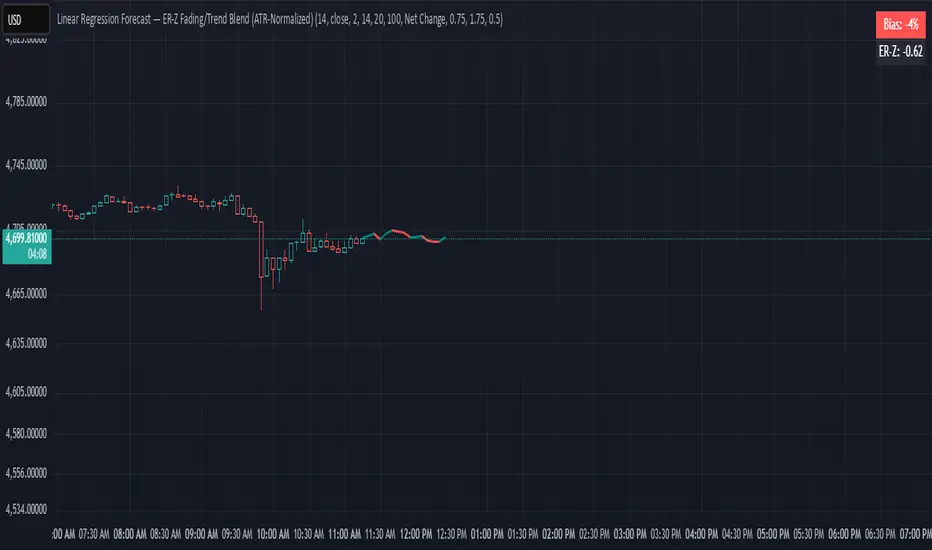
This indicator computes a series of simple linear regressions anchored at the current bar, using look-back windows from 2 bars up to the user-defined maximum. Each regression line is projected forward by the same number of bars as its look-back, producing a family of forecast endpoints. These endpoints are then connected into a continuous polyline: ascending segments are drawn in green, and descending segments in red.
Inputs:
maxLength – Maximum number of bars to include in the longest regression (minimum 2)
priceSource – Price series used for regression (for example, close, open, high, low)
lineWidth – Width of each line segment
Calculation:
For each window size N (from 2 to maxLength):
• Compute least-squares slope and intercept over the N most recent bars (with bar 0 = current bar, bar 1 = one bar ago, etc.).
• Project the regression line to bar_index + N to obtain the forecast price.
Collected forecast points are sorted by projection horizon and then joined:
• First segment: current bar’s price → first forecast point
• Subsequent segments: each forecast point → next forecast point
Segment colors reflect slope direction: green for non-negative, red for negative.
Usage:
Apply this overlay to any price chart. Adjust maxLength to control the depth and reach of the forecast fan. Observe how shorter windows produce nearer-term, more reactive projections, while longer windows yield smoother, more conservative forecasts. Use the colored segments to gauge the overall bias of the fan at each step.
Limitations:
This tool is for informational and educational purposes only. It relies on linear regression assumptions and past price behavior; it does not guarantee future performance. Users should combine it with other technical or fundamental analyses and risk management practices.
リリースノート
flipリリースノート
Bias displayリリースノート
updateリリースノート
update bias calculationリリースノート
update chartリリースノート
uses Efficiency Ratio instead of ADXリリースノート
ER adaptive accumulationリリースノート
labelリリースノート
uses Z-score of Efficiency Ratio for fade - trend-following logicリリースノート
colorオープンソーススクリプト
TradingViewの精神に則り、このスクリプトの作者はコードをオープンソースとして公開してくれました。トレーダーが内容を確認・検証できるようにという配慮です。作者に拍手を送りましょう!無料で利用できますが、コードの再公開はハウスルールに従う必要があります。
免責事項
この情報および投稿は、TradingViewが提供または推奨する金融、投資、トレード、その他のアドバイスや推奨を意図するものではなく、それらを構成するものでもありません。詳細は利用規約をご覧ください。
オープンソーススクリプト
TradingViewの精神に則り、このスクリプトの作者はコードをオープンソースとして公開してくれました。トレーダーが内容を確認・検証できるようにという配慮です。作者に拍手を送りましょう!無料で利用できますが、コードの再公開はハウスルールに従う必要があります。
免責事項
この情報および投稿は、TradingViewが提供または推奨する金融、投資、トレード、その他のアドバイスや推奨を意図するものではなく、それらを構成するものでもありません。詳細は利用規約をご覧ください。