OPEN-SOURCE SCRIPT
Daryl Guppy's Multiple Moving Averages - GMMA
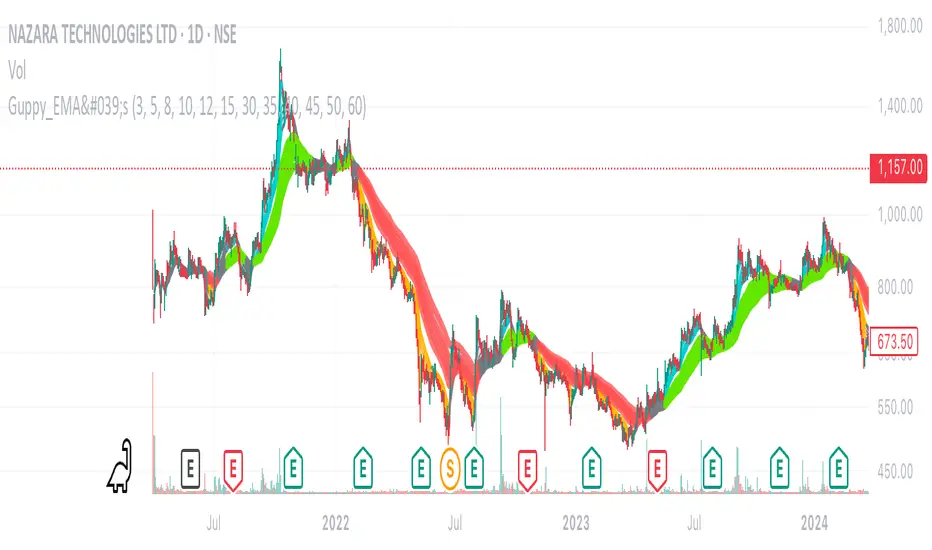
The Guppy EMAs indicator (Daryl Guppy’s method) displays two groups of exponential moving averages (EMAs) on the chart:
Fast EMA group: 3, 5, 8, 10, 12, 15 periods (thinner, more responsive lines)
Slow EMA group: 30, 35, 40, 45, 50, 60 periods (thicker, smoother lines)
Color Logic:
Fast EMAs turn AQUA if all fast EMAs are in bullish alignment and slow EMAs are in bullish alignment.
Fast EMAs turn ORANGE if all fast EMAs are in bearish alignment and slow EMAs are in bearish alignment.
Otherwise, fast EMAs appear GRAY.
Slow EMAs turn LIME when in bullish order, RED when bearish, and remain GRAY otherwise.
The area between the outermost fast EMAs and slow EMAs is filled with a semi-transparent silver color for visual emphasis.
オープンソーススクリプト
TradingViewの精神に則り、このスクリプトの作者はコードをオープンソースとして公開してくれました。トレーダーが内容を確認・検証できるようにという配慮です。作者に拍手を送りましょう!無料で利用できますが、コードの再公開はハウスルールに従う必要があります。
免責事項
この情報および投稿は、TradingViewが提供または推奨する金融、投資、トレード、その他のアドバイスや推奨を意図するものではなく、それらを構成するものでもありません。詳細は利用規約をご覧ください。
オープンソーススクリプト
TradingViewの精神に則り、このスクリプトの作者はコードをオープンソースとして公開してくれました。トレーダーが内容を確認・検証できるようにという配慮です。作者に拍手を送りましょう!無料で利用できますが、コードの再公開はハウスルールに従う必要があります。
免責事項
この情報および投稿は、TradingViewが提供または推奨する金融、投資、トレード、その他のアドバイスや推奨を意図するものではなく、それらを構成するものでもありません。詳細は利用規約をご覧ください。