PROTECTED SOURCE SCRIPT
NK-Macd + Rsi3
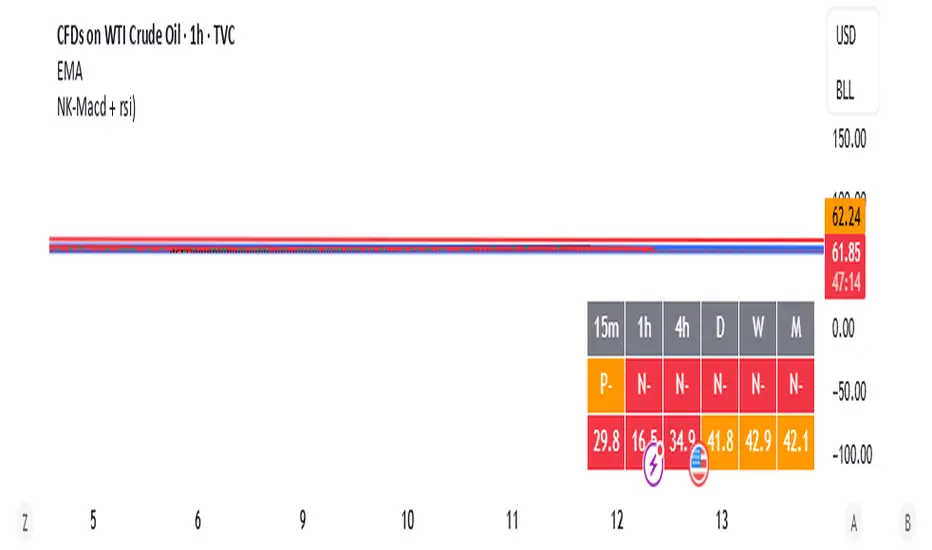
Here in one table you can see the MACD of the different time frame that what is the status of the MACD, is it above zero line or below zero line.
Second you will see in table that RSI number of all time frame, so here we dont need to go and check RSI by switching the chart and time frame.
at one place you will see both RSI and MACD, and by seeing the number you can check when the price in oversold zone and when it will in overbought also you can see the when the price in momentum and when not.
Example :- let assume RSI table showing above 40 in 1 hr and 67 in daily that means RSI is in swing momentum in hrly but momentum in daily.
保護スクリプト
このスクリプトのソースコードは非公開で投稿されています。 ただし、制限なく自由に使用できます – 詳細はこちらでご確認ください。
免責事項
この情報および投稿は、TradingViewが提供または推奨する金融、投資、トレード、その他のアドバイスや推奨を意図するものではなく、それらを構成するものでもありません。詳細は利用規約をご覧ください。
保護スクリプト
このスクリプトのソースコードは非公開で投稿されています。 ただし、制限なく自由に使用できます – 詳細はこちらでご確認ください。
免責事項
この情報および投稿は、TradingViewが提供または推奨する金融、投資、トレード、その他のアドバイスや推奨を意図するものではなく、それらを構成するものでもありません。詳細は利用規約をご覧ください。