INVITE-ONLY SCRIPT
更新済 Normalized Volume Zone [Orderflowing]
Normalized Volume Zone | Normalized VZO | Volume Analysis | Normalization (+) | Customizable (+)
Built using Pine Script V5.
Introduction
The Normalized Volume Zone is an indicator rooted in the classic VZO concept, this indicator takes a step further by normalizing the volume data.
Ideal for traders who rely heavily on volume data and seek a normalized dataset to interpret volume trends and signals.
Inspiration and Innovation
The tool builds upon the foundational concepts of the Volume Zone Oscillator (VZO), introduced by Walid Khalil and David Steckler.
This indicator enhances the traditional VZO by introducing advanced normalization calculations, offering traders a new approach to volume-based market analysis.
Core Features
*Some of the normalization methods require that you change the length of smoothing.
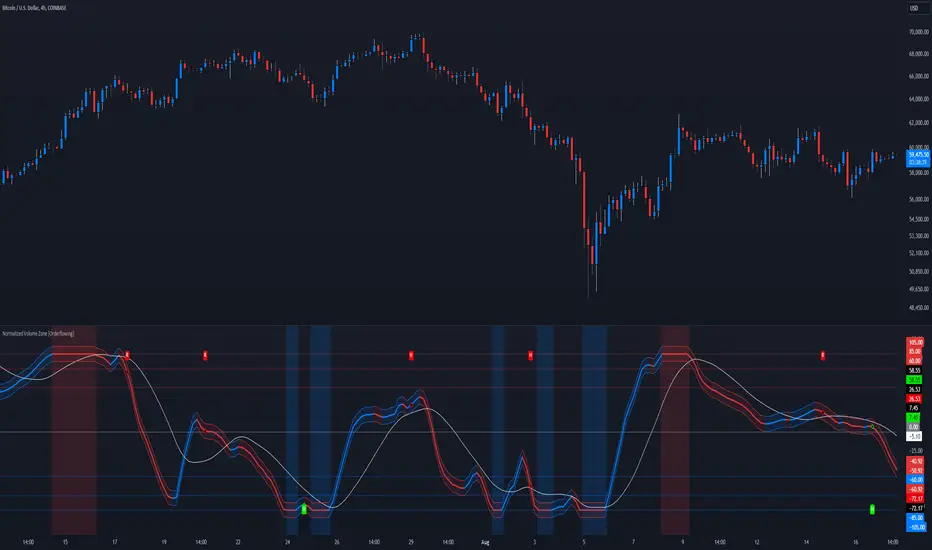
Example of Multi-Timeframe (4H Calculation on 30M Chart):

Example of HMA Smoothing & Z-Score Normalization:

Functionality
Usage and Applications
Conclusion
The Normalized Volume Zone indicator stands as a great indicator in volume-based trading analysis.
By normalizing the data, it offers traders a custom view of the volume oscillation.
This indicator is particularly valuable for those who prioritize volume in their analysis, providing a good view of market strength and momentum.
It is important to remember that while this indicator offers volume analysis, it is not recommended to only use this for trading decisions.
Built using Pine Script V5.
Introduction
The Normalized Volume Zone is an indicator rooted in the classic VZO concept, this indicator takes a step further by normalizing the volume data.
Ideal for traders who rely heavily on volume data and seek a normalized dataset to interpret volume trends and signals.
Inspiration and Innovation
The tool builds upon the foundational concepts of the Volume Zone Oscillator (VZO), introduced by Walid Khalil and David Steckler.
This indicator enhances the traditional VZO by introducing advanced normalization calculations, offering traders a new approach to volume-based market analysis.
Core Features
- Calculation Sources: Choose from HLC3, OHLC4, close, or open for VZO calculations.
- Customizable Periods: Set your preferred periods for VZO calculation, MA length, and percentile lookback, the indicator bends to your trading style.
- Advanced Smoothing Options: Select from a range of smoothing methods like HMA, Fourier, SMA, EMA, WMA, DEMA, and TEMA for the VZO line.
- Normalization Techniques: Apply normalization methods such as Percentile, Min-Max, Z-Score, or Log to the VZO data.*
- Visual Enhancements: Color-coded VZO and MA lines, along with optional dots for significant changes, provide clear visual cues for easier interpretation.
- Multi-Timeframe: Can be used on different timeframes for calculation.
*Some of the normalization methods require that you change the length of smoothing.
Example of Multi-Timeframe (4H Calculation on 30M Chart):
Example of HMA Smoothing & Z-Score Normalization:
Functionality
- Normalization: The indicator normalizes the smoothed VZO data, making it more consistent and comparable across different trading scenarios.
- Visual: The color changes in the VZO and MA lines, along with the optional dots, offer dynamic visual feedback on market conditions.
Usage and Applications
- Volume Trend Analysis: The normalized VZO provides a good picture of volume trends, helping traders identify potential reversals or continuation patterns.
- Comparative Analysis: Normalization allows for more meaningful comparisons of volume data across different instruments or time frames.
- Risk Management: Use the indicator to filter instrument strength and volatility.
Conclusion
The Normalized Volume Zone indicator stands as a great indicator in volume-based trading analysis.
By normalizing the data, it offers traders a custom view of the volume oscillation.
This indicator is particularly valuable for those who prioritize volume in their analysis, providing a good view of market strength and momentum.
It is important to remember that while this indicator offers volume analysis, it is not recommended to only use this for trading decisions.
リリースノート
V1.1 - Reworked Inputs Section.Reworked Divergence Logic.
Added Toggle Option For Visualizing VZO Trend Shift.
Added Band Visual Option.
リリースノート
V1.2 - Pine Script™ v6 Update招待専用スクリプト
このスクリプトは作者が承認したユーザーのみアクセス可能です。使用するにはアクセス申請をして許可を得る必要があります。通常は支払い後に承認されます。詳細は下記の作者の指示に従うか、Orderflowingに直接お問い合わせください。
TradingViewは、作者を完全に信頼し、スクリプトの動作を理解していない限り、有料スクリプトの購入・使用を推奨しません。コミュニティスクリプトには無料のオープンソースの代替が多数あります。
作者の指示
To start using this script, please visit our site: https://orderflowing.com for access.
William | Orderflowing
Develop Edge For Markets™
Indicators:
tradingview.com/u/Orderflowing/
orderflowing.com/indicators
Get Instant Access: orderflowing.com/pricing
Develop Edge For Markets™
Indicators:
tradingview.com/u/Orderflowing/
orderflowing.com/indicators
Get Instant Access: orderflowing.com/pricing
免責事項
この情報および投稿は、TradingViewが提供または推奨する金融、投資、トレード、その他のアドバイスや推奨を意図するものではなく、それらを構成するものでもありません。詳細は利用規約をご覧ください。
招待専用スクリプト
このスクリプトは作者が承認したユーザーのみアクセス可能です。使用するにはアクセス申請をして許可を得る必要があります。通常は支払い後に承認されます。詳細は下記の作者の指示に従うか、Orderflowingに直接お問い合わせください。
TradingViewは、作者を完全に信頼し、スクリプトの動作を理解していない限り、有料スクリプトの購入・使用を推奨しません。コミュニティスクリプトには無料のオープンソースの代替が多数あります。
作者の指示
To start using this script, please visit our site: https://orderflowing.com for access.
William | Orderflowing
Develop Edge For Markets™
Indicators:
tradingview.com/u/Orderflowing/
orderflowing.com/indicators
Get Instant Access: orderflowing.com/pricing
Develop Edge For Markets™
Indicators:
tradingview.com/u/Orderflowing/
orderflowing.com/indicators
Get Instant Access: orderflowing.com/pricing
免責事項
この情報および投稿は、TradingViewが提供または推奨する金融、投資、トレード、その他のアドバイスや推奨を意図するものではなく、それらを構成するものでもありません。詳細は利用規約をご覧ください。