OPEN-SOURCE SCRIPT
LETHINH RSI

Title:
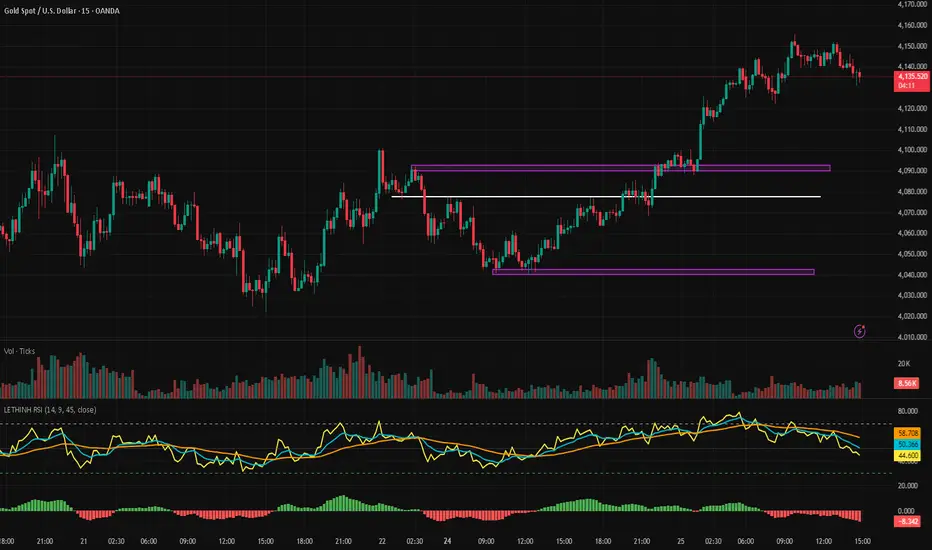
RSI + EMA9 + WMA45 Strength Flow Indicator
Description:
This indicator enhances the traditional RSI by combining it with two dynamic moving averages (EMA9 and WMA45) applied directly to the RSI line. The goal is to help traders visually identify momentum strength, trend confirmation, and potential reversal points with greater accuracy.
How It Works:
• RSI (14): Measures market momentum and identifies overbought/oversold conditions.
• EMA9 on RSI: A fast-response signal line that tracks short-term shifts in buyer/seller strength.
• WMA45 on RSI: A slower, smoother indication of long-term momentum flow and trend bias.
Key Signals:
1. EMA9 crosses above WMA45: Momentum turning bullish → potential buy signal.
2. EMA9 crosses below WMA45: Momentum turning bearish → potential sell signal.
3. RSI above 50 + EMA9 above WMA45: Strong bullish environment.
4. RSI below 50 + EMA9 below WMA45: Strong bearish environment.
5. RSI approaching 70/30: Warning zones for exhaustion or potential reversals.
Use Cases:
• Spot momentum reversals earlier than RSI alone.
• Confirm entries when price structure and momentum agree.
• Filter out false breakouts during low-volatility or choppy conditions.
• Strength-based scalping, swing trading, or trend following.
Best Timeframes:
Works on all timeframes, especially effective on M1–M15 for scalping and H1–H4 for swing trading.
オープンソーススクリプト
TradingViewの精神に則り、このスクリプトの作者はコードをオープンソースとして公開してくれました。トレーダーが内容を確認・検証できるようにという配慮です。作者に拍手を送りましょう!無料で利用できますが、コードの再公開はハウスルールに従う必要があります。
免責事項
この情報および投稿は、TradingViewが提供または推奨する金融、投資、トレード、その他のアドバイスや推奨を意図するものではなく、それらを構成するものでもありません。詳細は利用規約をご覧ください。
オープンソーススクリプト
TradingViewの精神に則り、このスクリプトの作者はコードをオープンソースとして公開してくれました。トレーダーが内容を確認・検証できるようにという配慮です。作者に拍手を送りましょう!無料で利用できますが、コードの再公開はハウスルールに従う必要があります。
免責事項
この情報および投稿は、TradingViewが提供または推奨する金融、投資、トレード、その他のアドバイスや推奨を意図するものではなく、それらを構成するものでもありません。詳細は利用規約をご覧ください。