OPEN-SOURCE SCRIPT
Price Scenarios - The Quant Science
GENERAL OVERVIEW
Price Scenarios - The Quant Science is a quantitative statistical indicator that provides a forecast probability about future prices moving using the mathematical-statistical formula of statistical probability and expected value.
https://www.tradingview.com/x/OelfF4iR/
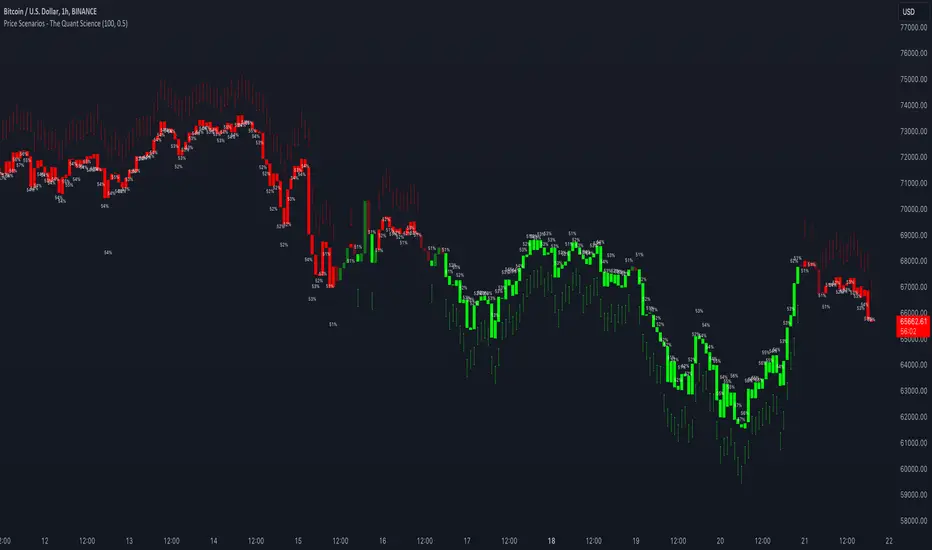
HOW TO USE
The indicator displays arrow-shaped signals that represent the probable future price movement calculated by the indicator, including the current percentage probability. Additionally, the candlesticks are colored based on the predicted direction to facilitate visual analysis. By default, green is used for bullish movements and red for bearish movements. The trader can set the analysis period (default value is 200) and the percentage threshold of probability to consider (default value is greater than 0.50 or 50%) through the user interface.
https://www.tradingview.com/x/Xw6iQecO/
USER INTERFACE
Lenght analysis: with this features you can handle the length of the dataset to be used for estimating statistical probabilities.
https://www.tradingview.com/x/PBUbP0O3/
Expected value: with this feature you can handle the threshold of the expected value to filter, only probabilities greater than this threshold will be considered by the model. By default, it is set to 0.50, which is equivalent to 50%.
https://www.tradingview.com/x/XjAUkspn/
Design Settings: modify the colors of your indicator with just a few clicks by managing this function.
https://www.tradingview.com/x/WAQySPHn/
We recommend disabling 'Wick' and 'Border' from the settings panel for a smoother and more efficient user experience.
https://www.tradingview.com/x/ZvTAJ1vC/
Price Scenarios - The Quant Science is a quantitative statistical indicator that provides a forecast probability about future prices moving using the mathematical-statistical formula of statistical probability and expected value.
https://www.tradingview.com/x/OelfF4iR/
HOW TO USE
The indicator displays arrow-shaped signals that represent the probable future price movement calculated by the indicator, including the current percentage probability. Additionally, the candlesticks are colored based on the predicted direction to facilitate visual analysis. By default, green is used for bullish movements and red for bearish movements. The trader can set the analysis period (default value is 200) and the percentage threshold of probability to consider (default value is greater than 0.50 or 50%) through the user interface.
https://www.tradingview.com/x/Xw6iQecO/
USER INTERFACE
Lenght analysis: with this features you can handle the length of the dataset to be used for estimating statistical probabilities.
https://www.tradingview.com/x/PBUbP0O3/
Expected value: with this feature you can handle the threshold of the expected value to filter, only probabilities greater than this threshold will be considered by the model. By default, it is set to 0.50, which is equivalent to 50%.
https://www.tradingview.com/x/XjAUkspn/
Design Settings: modify the colors of your indicator with just a few clicks by managing this function.
https://www.tradingview.com/x/WAQySPHn/
We recommend disabling 'Wick' and 'Border' from the settings panel for a smoother and more efficient user experience.
https://www.tradingview.com/x/ZvTAJ1vC/
オープンソーススクリプト
TradingViewの精神に則り、このスクリプトの作者はコードをオープンソースとして公開してくれました。トレーダーが内容を確認・検証できるようにという配慮です。作者に拍手を送りましょう!無料で利用できますが、コードの再公開はハウスルールに従う必要があります。
免責事項
この情報および投稿は、TradingViewが提供または推奨する金融、投資、トレード、その他のアドバイスや推奨を意図するものではなく、それらを構成するものでもありません。詳細は利用規約をご覧ください。
オープンソーススクリプト
TradingViewの精神に則り、このスクリプトの作者はコードをオープンソースとして公開してくれました。トレーダーが内容を確認・検証できるようにという配慮です。作者に拍手を送りましょう!無料で利用できますが、コードの再公開はハウスルールに従う必要があります。
免責事項
この情報および投稿は、TradingViewが提供または推奨する金融、投資、トレード、その他のアドバイスや推奨を意図するものではなく、それらを構成するものでもありません。詳細は利用規約をご覧ください。