OPEN-SOURCE SCRIPT
更新済 Kijun-Sen Line
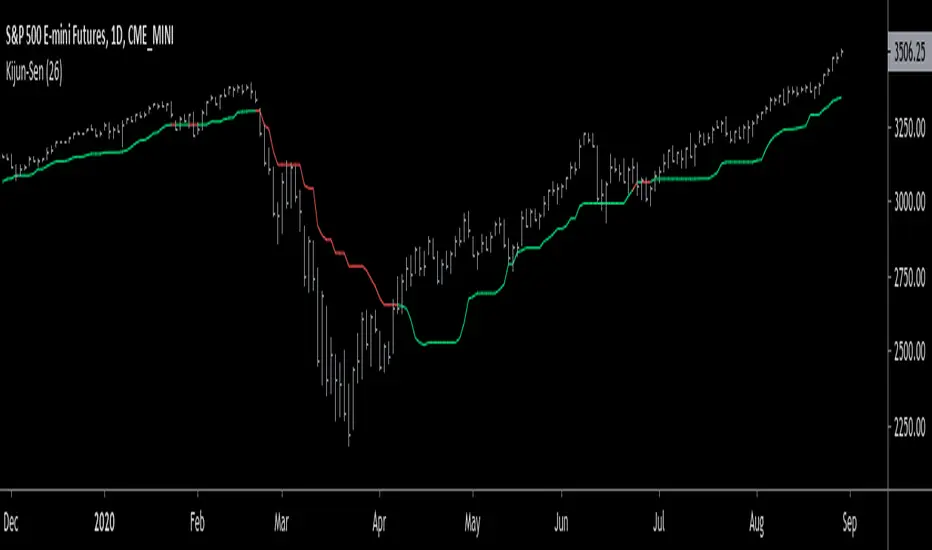
The Kijun-Sen line is an indicator that helps to identify the trend; whether that's up or down.
When the line is...
Green - Market is in an uptrend
Red - Market is in a downtrend
Recommended settings: 20 - 37 (26 is best)
The Kijun-Sen line, otherwise known as Baseline is simply the middle price between the highest high & the lowest low over a given period of time.
Calculation: (Highest high + lowest low)/2 = Baseline (Kijun-Sen)
The Kijun-Sen line was developed by Japanese journalist, Goichi Hosoda in the late 1960s. It was part of an indicator called the Ichimoku Cloud, an entire trend-trading system developed by the journalist himself. In my opinion, the Kijun-Sen is the most important part of the system.
Special thanks to VP & his Nononsense Forex Youtube Channel!
リリースノート
>>>Chg green to lime.
オープンソーススクリプト
TradingViewの精神に則り、このスクリプトの作者はコードをオープンソースとして公開してくれました。トレーダーが内容を確認・検証できるようにという配慮です。作者に拍手を送りましょう!無料で利用できますが、コードの再公開はハウスルールに従う必要があります。
免責事項
この情報および投稿は、TradingViewが提供または推奨する金融、投資、トレード、その他のアドバイスや推奨を意図するものではなく、それらを構成するものでもありません。詳細は利用規約をご覧ください。
オープンソーススクリプト
TradingViewの精神に則り、このスクリプトの作者はコードをオープンソースとして公開してくれました。トレーダーが内容を確認・検証できるようにという配慮です。作者に拍手を送りましょう!無料で利用できますが、コードの再公開はハウスルールに従う必要があります。
免責事項
この情報および投稿は、TradingViewが提供または推奨する金融、投資、トレード、その他のアドバイスや推奨を意図するものではなく、それらを構成するものでもありません。詳細は利用規約をご覧ください。