OPEN-SOURCE SCRIPT
real (colored) volume
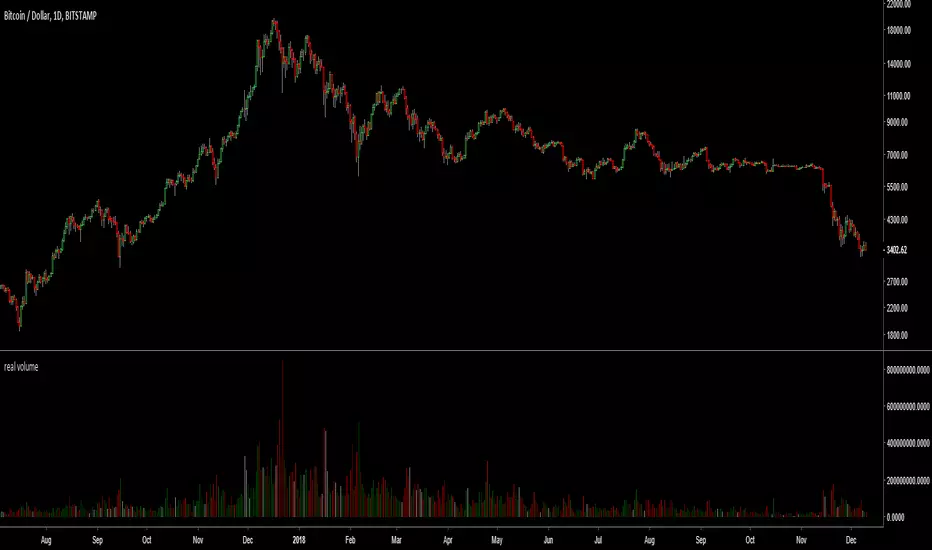
This script plots the volume in terms of the underlying base (e.g. USD or btc) not number of coins traded. It plots volume*mid price.
In addition, the volume color density depends on the candle body divided to high-low. Very green for long up candle body, grey means short candle body compared to high-low, very red for long down candle body. It may provide some indications of the strength of bulls versus bears.
In addition, the volume color density depends on the candle body divided to high-low. Very green for long up candle body, grey means short candle body compared to high-low, very red for long down candle body. It may provide some indications of the strength of bulls versus bears.
オープンソーススクリプト
TradingViewの精神に則り、このスクリプトの作者はコードをオープンソースとして公開してくれました。トレーダーが内容を確認・検証できるようにという配慮です。作者に拍手を送りましょう!無料で利用できますが、コードの再公開はハウスルールに従う必要があります。
免責事項
この情報および投稿は、TradingViewが提供または推奨する金融、投資、トレード、その他のアドバイスや推奨を意図するものではなく、それらを構成するものでもありません。詳細は利用規約をご覧ください。
オープンソーススクリプト
TradingViewの精神に則り、このスクリプトの作者はコードをオープンソースとして公開してくれました。トレーダーが内容を確認・検証できるようにという配慮です。作者に拍手を送りましょう!無料で利用できますが、コードの再公開はハウスルールに従う必要があります。
免責事項
この情報および投稿は、TradingViewが提供または推奨する金融、投資、トレード、その他のアドバイスや推奨を意図するものではなく、それらを構成するものでもありません。詳細は利用規約をご覧ください。