OPEN-SOURCE SCRIPT
更新済 KRMJ MA
overlays four moving averages on a TradingView chart to help traders identify trend direction, momentum shifts, and dynamic support or resistance levels. It includes a 9-period EMA, 21-period EMA, 20-period SMA, and a 200-period EMA. Each moving average serves a specific role: the 9 EMA responds quickly to price changes and highlights short-term momentum; the 21 EMA smooths out price action slightly more and confirms near-term trends. The 20 SMA provides a simple mid-range trend baseline often used in mean-reversion strategies or range-bound environments. The 200 EMA, a widely recognized long-term trend filter, helps users gauge the dominant market direction.
リリースノート
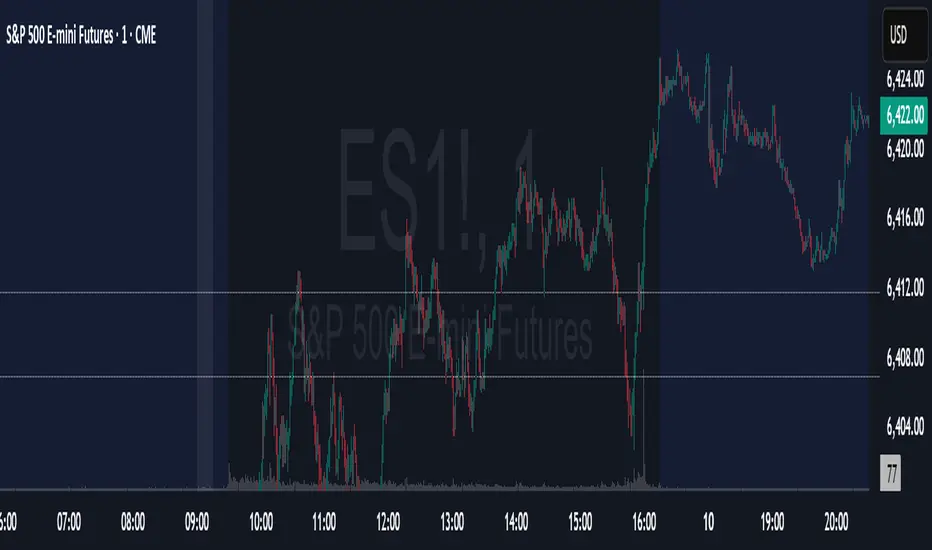
The KRMJ Indicator plots four hidden moving averages (13 EMA, 21 EMA, 20 SMA, 200 EMA) for reference, and automatically draws a light-blue dotted horizontal line each day from the 00:00 open price to 15:59, providing a clear visual reference for the day’s midnight session level.オープンソーススクリプト
TradingViewの精神に則り、このスクリプトの作者はコードをオープンソースとして公開してくれました。トレーダーが内容を確認・検証できるようにという配慮です。作者に拍手を送りましょう!無料で利用できますが、コードの再公開はハウスルールに従う必要があります。
免責事項
この情報および投稿は、TradingViewが提供または推奨する金融、投資、トレード、その他のアドバイスや推奨を意図するものではなく、それらを構成するものでもありません。詳細は利用規約をご覧ください。
オープンソーススクリプト
TradingViewの精神に則り、このスクリプトの作者はコードをオープンソースとして公開してくれました。トレーダーが内容を確認・検証できるようにという配慮です。作者に拍手を送りましょう!無料で利用できますが、コードの再公開はハウスルールに従う必要があります。
免責事項
この情報および投稿は、TradingViewが提供または推奨する金融、投資、トレード、その他のアドバイスや推奨を意図するものではなく、それらを構成するものでもありません。詳細は利用規約をご覧ください。