OPEN-SOURCE SCRIPT
Percentage Movement Marker
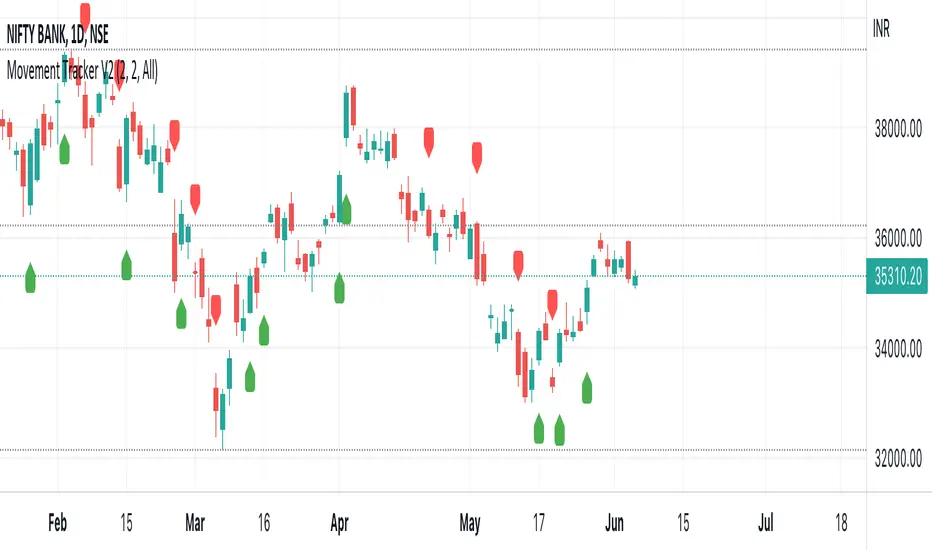
This indicator works on Data on closing basis and can be used to identify day wise price movements on the applied charts.
E.g. You want to find the Thursdays on which a particular script has given more than 2% Bullish Move.
You select 'Thursday' in the selected day setting and put 2% in the Bullish move setting.
This will mark Thursday on the chart as 'X' and mark those those Thursdays with a green arrow where the % Move was more than 2 %.
オープンソーススクリプト
TradingViewの精神に則り、このスクリプトの作者はコードをオープンソースとして公開してくれました。トレーダーが内容を確認・検証できるようにという配慮です。作者に拍手を送りましょう!無料で利用できますが、コードの再公開はハウスルールに従う必要があります。
免責事項
この情報および投稿は、TradingViewが提供または推奨する金融、投資、トレード、その他のアドバイスや推奨を意図するものではなく、それらを構成するものでもありません。詳細は利用規約をご覧ください。
オープンソーススクリプト
TradingViewの精神に則り、このスクリプトの作者はコードをオープンソースとして公開してくれました。トレーダーが内容を確認・検証できるようにという配慮です。作者に拍手を送りましょう!無料で利用できますが、コードの再公開はハウスルールに従う必要があります。
免責事項
この情報および投稿は、TradingViewが提供または推奨する金融、投資、トレード、その他のアドバイスや推奨を意図するものではなく、それらを構成するものでもありません。詳細は利用規約をご覧ください。