OPEN-SOURCE SCRIPT
更新済 Tracking Lines with TP/SL + Labels at Left
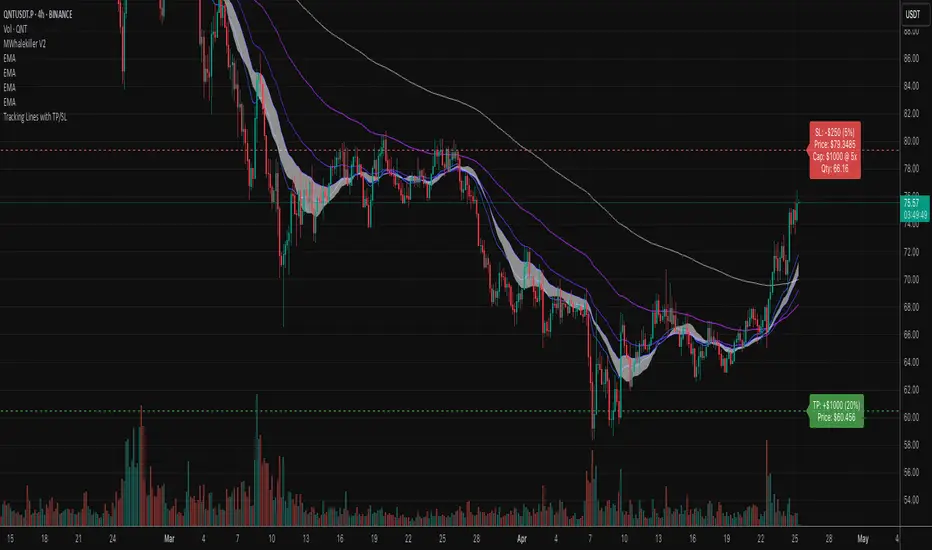
A simple indicator so you can set your TP and SL tolerance along with capital and leverage.
A red line and green line will represent where current TP and SL would be on the chart along with the number of tokens you need to trade to meet the USD capital to be trades.
Just gives a visual representation of SL to key zones on the chart so you can judge scalp entries a little better :)
A red line and green line will represent where current TP and SL would be on the chart along with the number of tokens you need to trade to meet the USD capital to be trades.
Just gives a visual representation of SL to key zones on the chart so you can judge scalp entries a little better :)
リリースノート
This indicator plots dynamic Take Profit (TP) and Stop Loss (SL) levels based on customizable percentages above and below the current price. It calculates and displays:Your total trade value based on capital and leverage
The dollar amount you stand to gain (TP) or lose (SL)
The number of tokens/contracts needed at current price
Fully customisable label colours and opacity for clean visuals
Ideal for quickly visualising profit/loss zones and managing risk with precision.
リリースノート
This indicator plots dynamic Take Profit (TP) and Stop Loss (SL) levels based on customizable percentages above and below the current price. It calculates and displays:Your total trade value based on capital and leverage
The dollar amount you stand to gain (TP) or lose (SL)
The number of tokens/contracts needed at current price
Fully customizable label colors and opacity for clean visuals
Ideal for quickly visualizing profit/loss zones and managing risk with precision.
オープンソーススクリプト
TradingViewの精神に則り、このスクリプトの作者はコードをオープンソースとして公開してくれました。トレーダーが内容を確認・検証できるようにという配慮です。作者に拍手を送りましょう!無料で利用できますが、コードの再公開はハウスルールに従う必要があります。
免責事項
この情報および投稿は、TradingViewが提供または推奨する金融、投資、トレード、その他のアドバイスや推奨を意図するものではなく、それらを構成するものでもありません。詳細は利用規約をご覧ください。
オープンソーススクリプト
TradingViewの精神に則り、このスクリプトの作者はコードをオープンソースとして公開してくれました。トレーダーが内容を確認・検証できるようにという配慮です。作者に拍手を送りましょう!無料で利用できますが、コードの再公開はハウスルールに従う必要があります。
免責事項
この情報および投稿は、TradingViewが提供または推奨する金融、投資、トレード、その他のアドバイスや推奨を意図するものではなく、それらを構成するものでもありません。詳細は利用規約をご覧ください。