OPEN-SOURCE SCRIPT
Volume Weighted Average Price Z-Score [tordne]
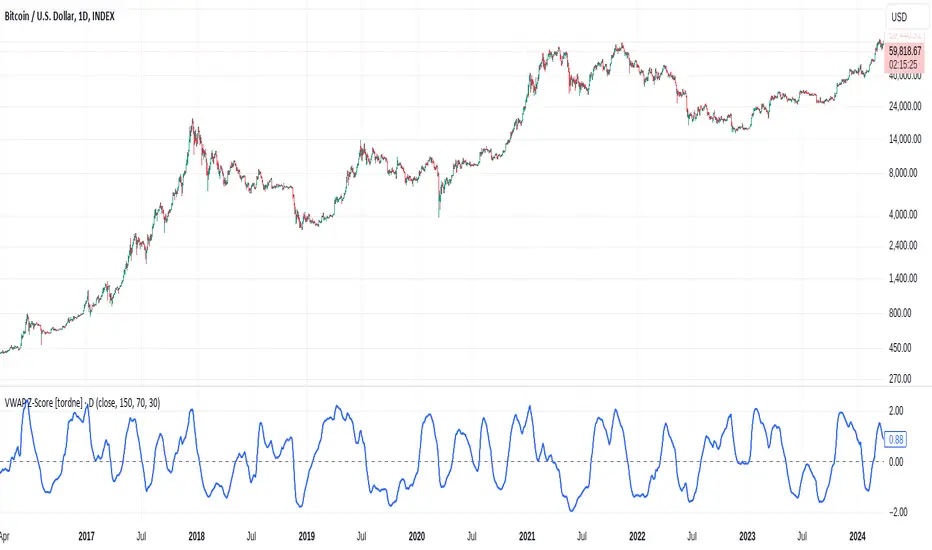
The VWAP Z-Score indicator calculates the Z-score of the Volume Weighted Average Price (VWAP) Ratio, allowing traders to analyze how the current price compares to the VWAP over a specified period. This can provide insights into the relative price strength, overbought/oversold conditions, and price deviations from its average.
Key Components:
VWAP Calculation:
VWAP (Volume Weighted Average Price) is the ratio of the cumulative traded value (price multiplied by volume) to the cumulative volume over a specified period (VWAP Calculation Length).
The VWAP Ratio is then computed by dividing the current price (or selected source) by the calculated VWAP.
Z-Score Calculation:
The Z-score is a statistical measure that shows how far the current VWAP Ratio deviates from its mean, in terms of standard deviations.
The Z-score is calculated by comparing the VWAP Ratio to its moving average (Z-Score Length) and dividing the difference by the standard deviation of the VWAP Ratio over the same period.
This helps in identifying whether the current price is unusually high or low relative to its VWAP.
Smoothing:
The Z-score is further smoothed using an Exponential Moving Average (EMA) to reduce noise and enhance readability. The smoothing length is adjustable via the input settings (Smoothing Length), with a default value of 14 periods.
Input Parameters:
Source: The price source used for calculation (default is the closing price).
VWAP Calculation Length: Defines the period over which the VWAP is calculated (default is 150).
Z-Score Length: The lookback period for calculating the Z-score (default is 70).
Smoothing Length (EMA): The number of periods over which to smooth the Z-score using an EMA (default is 30).
Interpretation:
Z-Score:
A Z-score close to 0 indicates that the price is close to its VWAP.
A positive Z-score suggests that the price is higher than its VWAP, potentially indicating overbought conditions.
A negative Z-score suggests that the price is lower than its VWAP, potentially indicating oversold conditions.
This indicator provides a dynamic and statistical way of assessing price movements relative to VWAP, aiding in mean reversion strategies, trend following, or momentum analysis.
オープンソーススクリプト
TradingViewの精神に則り、このスクリプトの作者はコードをオープンソースとして公開してくれました。トレーダーが内容を確認・検証できるようにという配慮です。作者に拍手を送りましょう!無料で利用できますが、コードの再公開はハウスルールに従う必要があります。
免責事項
この情報および投稿は、TradingViewが提供または推奨する金融、投資、トレード、その他のアドバイスや推奨を意図するものではなく、それらを構成するものでもありません。詳細は利用規約をご覧ください。
オープンソーススクリプト
TradingViewの精神に則り、このスクリプトの作者はコードをオープンソースとして公開してくれました。トレーダーが内容を確認・検証できるようにという配慮です。作者に拍手を送りましょう!無料で利用できますが、コードの再公開はハウスルールに従う必要があります。
免責事項
この情報および投稿は、TradingViewが提供または推奨する金融、投資、トレード、その他のアドバイスや推奨を意図するものではなく、それらを構成するものでもありません。詳細は利用規約をご覧ください。