OPEN-SOURCE SCRIPT
ECVD by bigmm
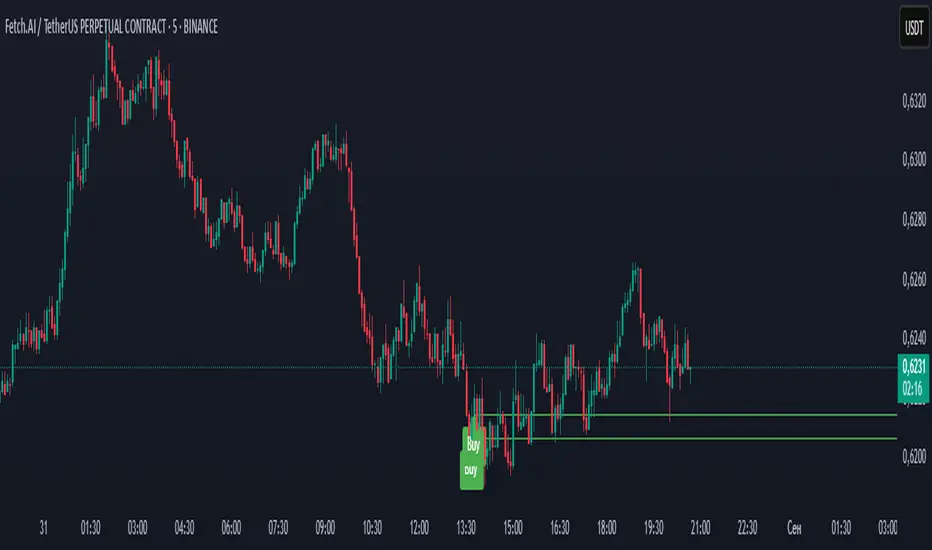
This indicator is designed for scalping and short-term trading, ideally used on 1-5 minute timeframes. It helps identify significant momentum shifts by tracking extreme volume imbalances between buying and selling pressure.
How It Works:
Trading Application:
Best Used For:
This tool works particularly well in combination with price action analysis and other momentum indicators for comprehensive trading decisions.
How It Works:
- The indicator calculates cumulative volume delta (the difference between buying and selling volumes) on a 1-hour timeframe
- It identifies the maximum and minimum delta values over the last 499 bars
- When the current delta reaches or exceeds these extreme values (100% of the recent extremes), it draws horizontal lines on the chart
- Red "Sell" lines appear when buying pressure reaches extreme levels
- Green "Buy" lines appear when selling pressure reaches extreme levels
Trading Application:
- On lower timeframes (1-5 min), these extreme readings often signal potential reversal points
- The lines act as dynamic support/resistance levels where price may react
- The indicator keeps only the 4 most recent lines (2 of each type) to avoid clutter
- Traders can use these signals to anticipate short-term price movements and manage risk
Best Used For:
- Scalping strategies on very short timeframes
- Identifying potential reversal points after strong momentum moves
- Confirming entry and exit points in conjunction with other indicators
- Understanding when volume extremes might be exhausted
This tool works particularly well in combination with price action analysis and other momentum indicators for comprehensive trading decisions.
オープンソーススクリプト
TradingViewの精神に則り、この作者はスクリプトのソースコードを公開しているので、その内容を理解し検証することができます。作者に感謝です!無料でお使いいただけますが、このコードを投稿に再利用する際にはハウスルールに従うものとします。
✅ В ТГ больше идей с указанием точек входа, стоп лосс, тейк профит.
📈 Подробная аналитика и логика входа.
💰Будем зарабатывать вместе с ММ.
t.me/bigmm_channel
📈 Подробная аналитика и логика входа.
💰Будем зарабатывать вместе с ММ.
t.me/bigmm_channel
免責事項
これらの情報および投稿は、TradingViewが提供または保証する金融、投資、取引、またはその他の種類のアドバイスや推奨を意図したものではなく、またそのようなものでもありません。詳しくは利用規約をご覧ください。