OPEN-SOURCE SCRIPT
更新済 Major Minor Fib Points
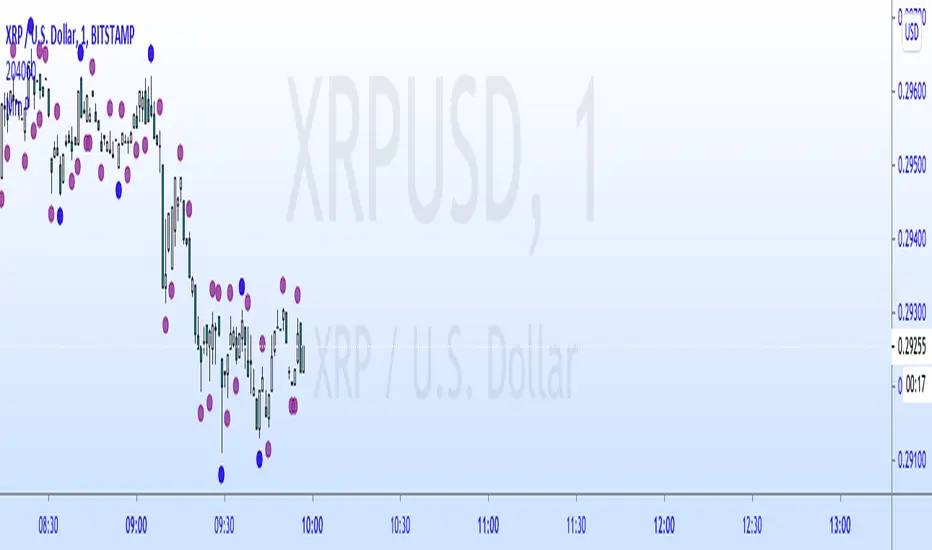
Hey guys I made this indicator that plots major and minor lows based on the candle duration since it's last seen a lower low or higher high.
I made this after watching a seminar and seeing it as a way to simply, easily and naturally find the plot points for fibonacci retracements and extentions.
Blue dots are Major, Purple are Minor.
The dots only appear if there has not been a newly established low or high in the default(13) periods (for Major) before or after that candle. This is done to make the pivot candle clear and less subjective. The periods are also changeable in the format icon.
Let me know what if you like/hate it. It's just another indicator and is only a visual tool. But I hope it helps. I hope it helps me as well!
リリースノート
Update: made shapes auto size nowリリースノート
Added alerts on requestオープンソーススクリプト
TradingViewの精神に則り、このスクリプトの作者はコードをオープンソースとして公開してくれました。トレーダーが内容を確認・検証できるようにという配慮です。作者に拍手を送りましょう!無料で利用できますが、コードの再公開はハウスルールに従う必要があります。
免責事項
この情報および投稿は、TradingViewが提供または推奨する金融、投資、トレード、その他のアドバイスや推奨を意図するものではなく、それらを構成するものでもありません。詳細は利用規約をご覧ください。
オープンソーススクリプト
TradingViewの精神に則り、このスクリプトの作者はコードをオープンソースとして公開してくれました。トレーダーが内容を確認・検証できるようにという配慮です。作者に拍手を送りましょう!無料で利用できますが、コードの再公開はハウスルールに従う必要があります。
免責事項
この情報および投稿は、TradingViewが提供または推奨する金融、投資、トレード、その他のアドバイスや推奨を意図するものではなく、それらを構成するものでもありません。詳細は利用規約をご覧ください。