OPEN-SOURCE SCRIPT
Stochastic Structure Analyzer
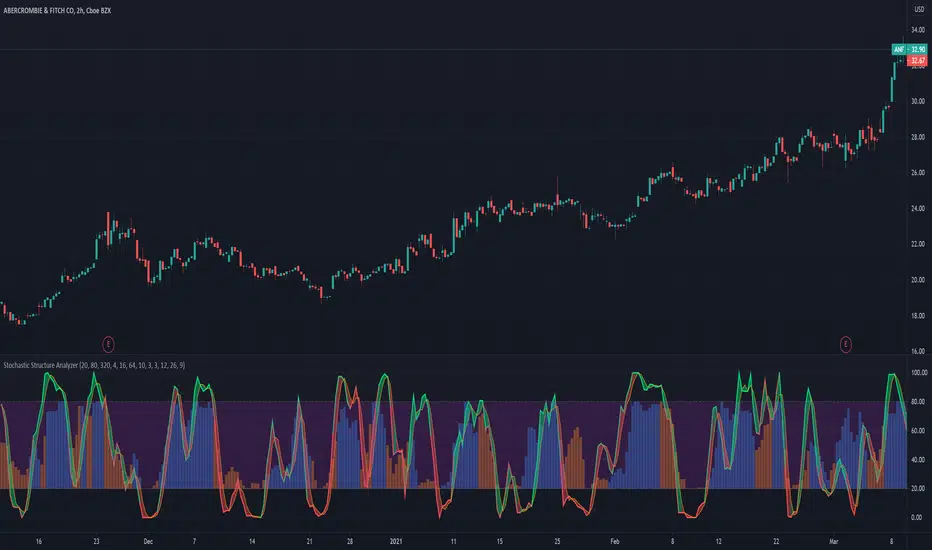
A momentum indicator that uses the highest and lowest values for price in three different lookback lengths to find the performance relative to three timeframes.
- Stochastic can be used for buy and sell signals as usual.
- The bars at the back represent the stochastic value of the OBV based structure calculation.
- The color of the stochastic line is a preliminary indicator of an up move.
- The fill color between the stochastic lines indicate the trend strength,
How to use: I suggest combining this with a higher timeframe to buy when the both stochastics are crossing below 20 line. And sell when one of the stochastics crosses-down.
This is the stochastic version of the structure analyzer(tradingview.com/script/66qgS9gj-Structure-Analyzer/).
オープンソーススクリプト
TradingViewの精神に則り、このスクリプトの作者はコードをオープンソースとして公開してくれました。トレーダーが内容を確認・検証できるようにという配慮です。作者に拍手を送りましょう!無料で利用できますが、コードの再公開はハウスルールに従う必要があります。
免責事項
この情報および投稿は、TradingViewが提供または推奨する金融、投資、トレード、その他のアドバイスや推奨を意図するものではなく、それらを構成するものでもありません。詳細は利用規約をご覧ください。
オープンソーススクリプト
TradingViewの精神に則り、このスクリプトの作者はコードをオープンソースとして公開してくれました。トレーダーが内容を確認・検証できるようにという配慮です。作者に拍手を送りましょう!無料で利用できますが、コードの再公開はハウスルールに従う必要があります。
免責事項
この情報および投稿は、TradingViewが提供または推奨する金融、投資、トレード、その他のアドバイスや推奨を意図するものではなく、それらを構成するものでもありません。詳細は利用規約をご覧ください。