OPEN-SOURCE SCRIPT
更新済 Luckscout's Double Bollinger Bands Strategy

Long Trade Setups:
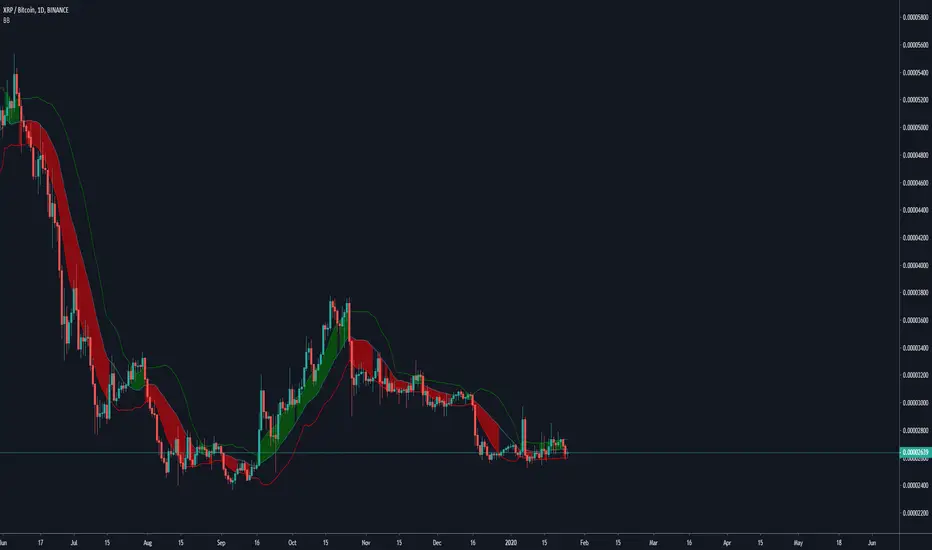
To go long (to buy), you have to wait for one of the candlesticks to close above the BB upper band. (background color is green)
Short Trade Setups:
To go short (to sell), you have to wait for one of the candlesticks to close below the BB lower band. (background color is red)
How To Maximize Your Profit?
As I explained above, this trading system is good in catching the trends. Therefore, you’d better to take the advantage of the strong movements and maximize your profit.
When there is a strong trade setup, you can also take two positions with the same stop loss, when there is a trade setup based on the Double Bollinger Bands trading system. Set a 2 x SL target for the first position, and no target for the second one. If the first position hits the target, move the second’s position stop loss to breakeven and hold it (TLDR : Hold a sell as long as background is red)
In case of a long position, hold the second position as long as the candlesticks form between the BB1 and BB2 upper bands, or above the Bollinger Middle Band. Close the second position when candlesticks start crossing the BB1 upper bands, or when one of the candlesticks breaks below the Bollinger Middle Band . (TLDR : Holda buy as long as background is green)
リリースノート
fixed fill color conditionsオープンソーススクリプト
TradingViewの精神に則り、このスクリプトの作者はコードをオープンソースとして公開してくれました。トレーダーが内容を確認・検証できるようにという配慮です。作者に拍手を送りましょう!無料で利用できますが、コードの再公開はハウスルールに従う必要があります。
免責事項
この情報および投稿は、TradingViewが提供または推奨する金融、投資、トレード、その他のアドバイスや推奨を意図するものではなく、それらを構成するものでもありません。詳細は利用規約をご覧ください。
オープンソーススクリプト
TradingViewの精神に則り、このスクリプトの作者はコードをオープンソースとして公開してくれました。トレーダーが内容を確認・検証できるようにという配慮です。作者に拍手を送りましょう!無料で利用できますが、コードの再公開はハウスルールに従う必要があります。
免責事項
この情報および投稿は、TradingViewが提供または推奨する金融、投資、トレード、その他のアドバイスや推奨を意図するものではなく、それらを構成するものでもありません。詳細は利用規約をご覧ください。