OPEN-SOURCE SCRIPT
更新済 MACD Multi-Timeframe Indicator
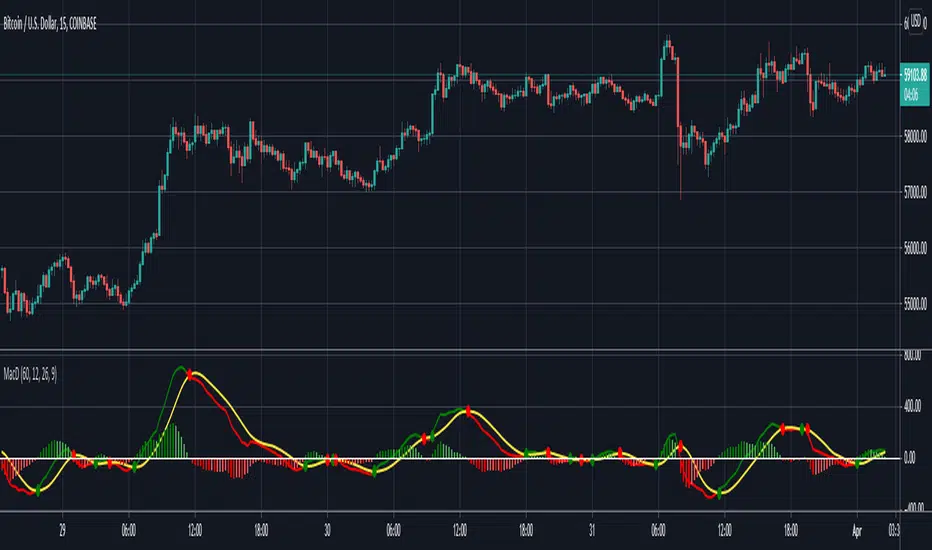
Hello everyone, this is indicator has always been my go-to MACD indicator for many years. It is such a beautiful easy to understand indicator. You can also view different timeframe resolutions which is helpful. When the MACD crosses up the signal line it is green, and when it crosses below the signal line it is red. The signal line is the constant yellow line. MACD histogram is dark green when increasing buying momentum, and you'll see the green get lighter when buy momentum is decreasing. As well, MACD histogram is dark red when increasing sell momentum, and you'll see the red get lighter when sell momentum is decreasing. I hope you guys love this macd design. Happy trading!
The MACD indicator can be used in many ways but my favorite way to use MACD by itself is by going long when macd < 0 & macd crosses above signal line, and going short when macd > 0 & macd crosses below signal line. I added those alerts for anyone interested.
The MACD indicator can be used in many ways but my favorite way to use MACD by itself is by going long when macd < 0 & macd crosses above signal line, and going short when macd > 0 & macd crosses below signal line. I added those alerts for anyone interested.
リリースノート
I updated the script to version 5 and made the source code more readable to the community.リリースノート
I fixed the MACD colors so they are more noticeable when MACD momentum is strong or weak.オープンソーススクリプト
TradingViewの精神に則り、このスクリプトの作者はコードをオープンソースとして公開してくれました。トレーダーが内容を確認・検証できるようにという配慮です。作者に拍手を送りましょう!無料で利用できますが、コードの再公開はハウスルールに従う必要があります。
免責事項
この情報および投稿は、TradingViewが提供または推奨する金融、投資、トレード、その他のアドバイスや推奨を意図するものではなく、それらを構成するものでもありません。詳細は利用規約をご覧ください。
オープンソーススクリプト
TradingViewの精神に則り、このスクリプトの作者はコードをオープンソースとして公開してくれました。トレーダーが内容を確認・検証できるようにという配慮です。作者に拍手を送りましょう!無料で利用できますが、コードの再公開はハウスルールに従う必要があります。
免責事項
この情報および投稿は、TradingViewが提供または推奨する金融、投資、トレード、その他のアドバイスや推奨を意図するものではなく、それらを構成するものでもありません。詳細は利用規約をご覧ください。