OPEN-SOURCE SCRIPT
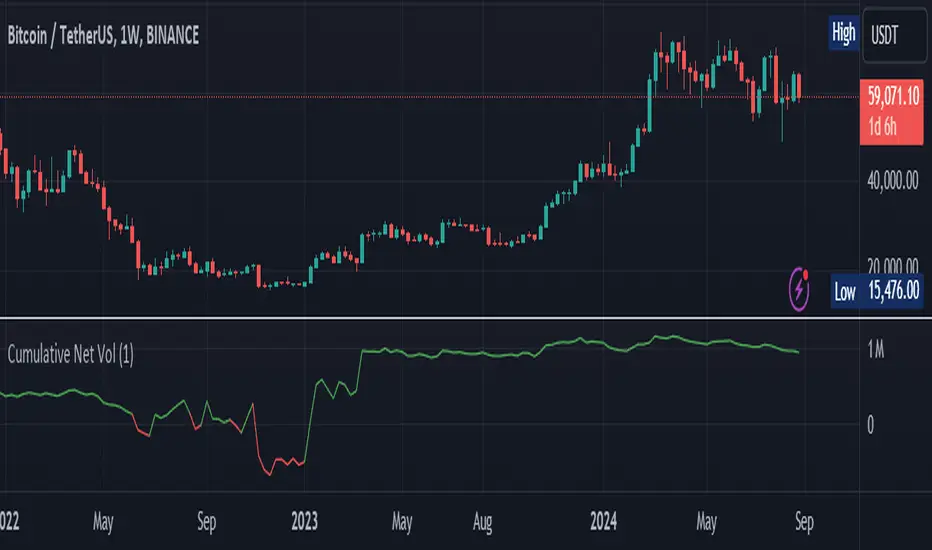
Cumulative Net Volume

Cumulative Calculation: Summarizes the net volume (buying minus selling volume) cumulatively, providing a running total that reflects the aggregate trading pressure.
Custom Timeframe Flexibility: Users can choose to analyze the volume on a custom timeframe, enhancing adaptability for various trading strategies.
Color-Coded Visualization: Features an intuitive color scheme where green indicates a net buying dominance and red signals net selling dominance, making it easier to interpret shifts in market dynamics.
Versatility: Suitable for all types of assets available on TradingView including cryptocurrencies like Bitcoin, stocks, forex, and more.
Utility: This tool is particularly useful for identifying trends in buying or selling pressure, which could be pivotal during significant market events or when assessing the potential for a trend reversal. By understanding the accumulation and distribution phases through the cumulative net volume, traders can make more informed decisions.
Perfect for both novice traders looking to get a grip on volume analysis and seasoned professionals seeking an edge in their trading tactics.
オープンソーススクリプト
TradingViewの精神に則り、このスクリプトの作者はコードをオープンソースとして公開してくれました。トレーダーが内容を確認・検証できるようにという配慮です。作者に拍手を送りましょう!無料で利用できますが、コードの再公開はハウスルールに従う必要があります。
免責事項
この情報および投稿は、TradingViewが提供または推奨する金融、投資、トレード、その他のアドバイスや推奨を意図するものではなく、それらを構成するものでもありません。詳細は利用規約をご覧ください。
オープンソーススクリプト
TradingViewの精神に則り、このスクリプトの作者はコードをオープンソースとして公開してくれました。トレーダーが内容を確認・検証できるようにという配慮です。作者に拍手を送りましょう!無料で利用できますが、コードの再公開はハウスルールに従う必要があります。
免責事項
この情報および投稿は、TradingViewが提供または推奨する金融、投資、トレード、その他のアドバイスや推奨を意図するものではなく、それらを構成するものでもありません。詳細は利用規約をご覧ください。