OPEN-SOURCE SCRIPT
更新済 Long Term Levels (4h, D, W, M, Q, & Y)
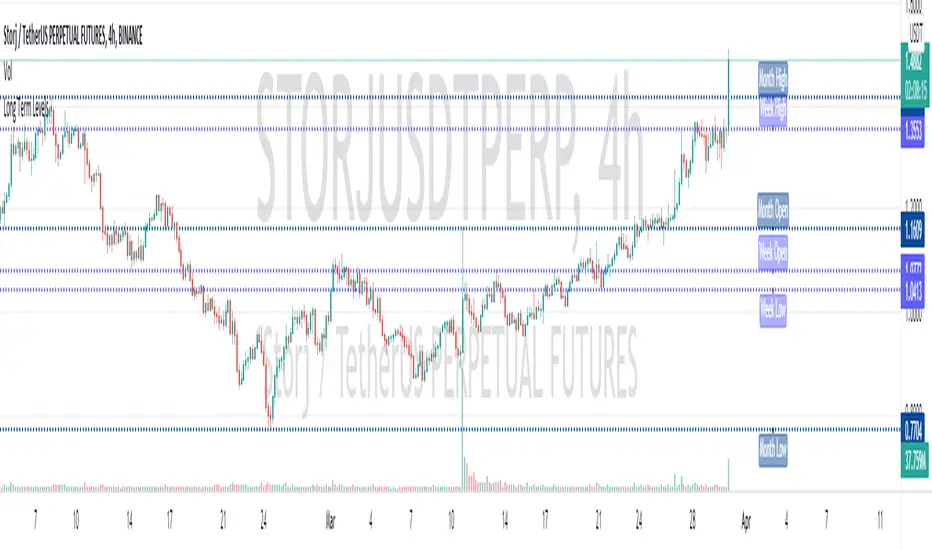
This shows and labels the highs and lows from the previous 4h, daily, weekly, monthly, quarterly and yearly session. By default it only shows weekly, monthly and yearly. It also has an option to use small labels (M vs Monthly High) to save your eyeballs. You may need to adjust your charts right hand margin to see them properly.
Everything is shown in very tasteful shades of blue. For a faster loading version of this check my other indicators.
Everything is shown in very tasteful shades of blue. For a faster loading version of this check my other indicators.
リリースノート
Fixed indicator titleリリースノート
Updated to v5, and made it a bit faster with less security() callsオープンソーススクリプト
TradingViewの精神に則り、このスクリプトの作者はコードをオープンソースとして公開してくれました。トレーダーが内容を確認・検証できるようにという配慮です。作者に拍手を送りましょう!無料で利用できますが、コードの再公開はハウスルールに従う必要があります。
免責事項
この情報および投稿は、TradingViewが提供または推奨する金融、投資、トレード、その他のアドバイスや推奨を意図するものではなく、それらを構成するものでもありません。詳細は利用規約をご覧ください。
オープンソーススクリプト
TradingViewの精神に則り、このスクリプトの作者はコードをオープンソースとして公開してくれました。トレーダーが内容を確認・検証できるようにという配慮です。作者に拍手を送りましょう!無料で利用できますが、コードの再公開はハウスルールに従う必要があります。
免責事項
この情報および投稿は、TradingViewが提供または推奨する金融、投資、トレード、その他のアドバイスや推奨を意図するものではなく、それらを構成するものでもありません。詳細は利用規約をご覧ください。