PROTECTED SOURCE SCRIPT
Rainbow Trend [Mc]
1. Momentum-Based Foundation
2. Long-Term Time Frame
3. Multicolored Gradient Lines
4. Horizontal Levels (Overbought/Oversold Zones)
5. Reversal Signal Markers
- This indicator measures the velocity and strength of price changes.
- Rising momentum indicates that price movement (upward or downward) has strength behind it.
- When momentum weakens or reverses, it often signals a potential trend reversal.
2. Long-Term Time Frame
- Unlike traditional indicators like RSI or Stochastic, which use shorter lookback periods (e.g., 14 days), this indicator uses a much longer period, such as 50 to 200 days.
- This extended range helps smooth out volatility and provides a clearer view of the primary trend.
3. Multicolored Gradient Lines
- The indicator displays multi-layered colored curves, often with a rainbow-like gradient.
- Red or pink areas indicate strong selling pressure or peak momentum in an uptrend.
- Green or bright green dots often suggest recovery or bottoming momentum.
- Orange or yellow colors indicate neutral or transition zones, awaiting trend confirmation.
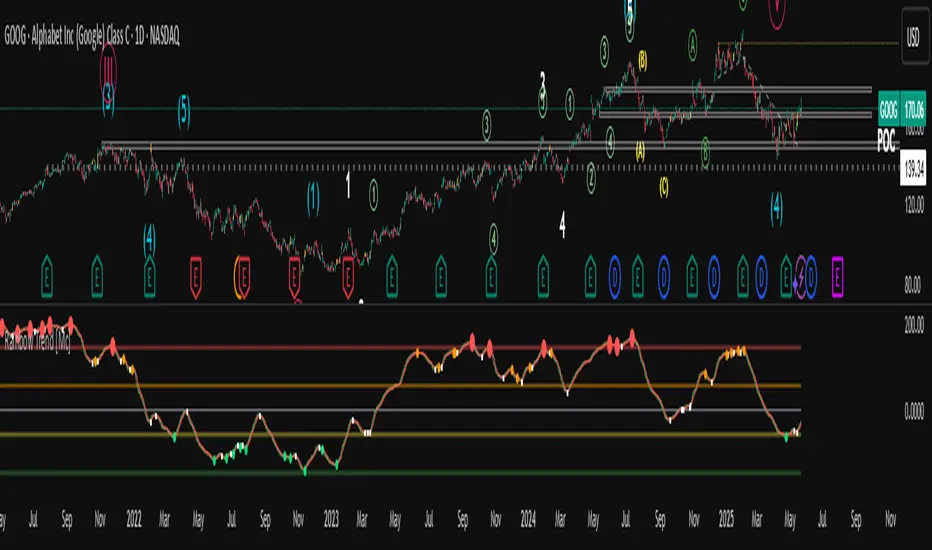
4. Horizontal Levels (Overbought/Oversold Zones)
- The chart includes reference levels such as +160, 0, -40, and -120 (as shown in the image).
- These levels help identify when momentum is reaching overbought or oversold conditions.
- Reversals often begin near the upper or lower extremes of these zones.
5. Reversal Signal Markers
- Red dots at the top indicate extreme bullish momentum and potential topping zones.
- Green dots at the bottom suggest oversold conditions and potential bullish reversals.
保護スクリプト
このスクリプトのソースコードは非公開で投稿されています。 ただし、制限なく自由に使用できます – 詳細はこちらでご確認ください。
免責事項
この情報および投稿は、TradingViewが提供または推奨する金融、投資、トレード、その他のアドバイスや推奨を意図するものではなく、それらを構成するものでもありません。詳細は利用規約をご覧ください。
免責事項
この情報および投稿は、TradingViewが提供または推奨する金融、投資、トレード、その他のアドバイスや推奨を意図するものではなく、それらを構成するものでもありません。詳細は利用規約をご覧ください。