OPEN-SOURCE SCRIPT
Hull Trend and Compare
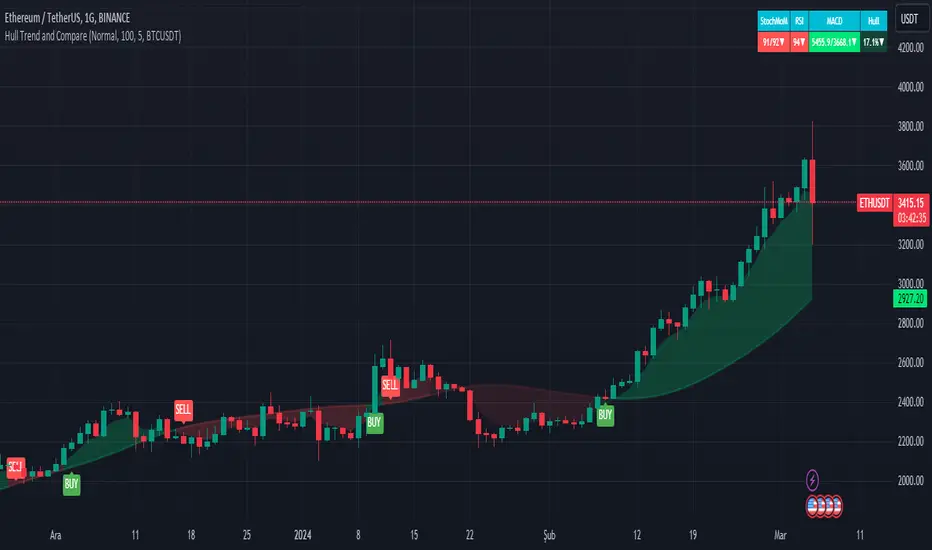
This Pine Script is a TradingView indicator called "Hull Trend and Compare." Its main purpose is to provide a visual representation of price trends and a comparative analysis between the selected symbol and another symbol chosen for comparison.
The key components and functionalities:
Price Trend Visualization:
1.Mode Selection:
Offers three modes: "Normal," "Linear," and "Heikin-Ashi."
Allows users to choose between a standard chart, linear regression, or Heikin-Ashi candlesticks.
2.Hull Moving Average (HullMA):
Calculates the HullMA for the selected mode and length.
Plots the HullMA on the chart.
Colors the background based on the relationship between HullMA and the closing price.
Generates buy and sell signals when the price crosses over or under the HullMA.
Symbol Comparison:
1.Comparison with Another Symbol:
Allows users to compare the selected symbol with another symbol (specified in the sym input).
Provides options to choose the method of calculation for the compared symbol (open, high, low, close).
Users can choose whether to use a different method of calculation (usem), adjust the length (len), and enable or disable comparison (usecmp).
Table Display:
1.Table for Technical Indicators:
Optionally displays a table showing technical indicators for both symbols.
Includes Stochastic Momentum, RSI (Relative Strength Index), and MACD (Moving Average Convergence Divergence).
Colors the table cells based on the direction of the indicators.
Users can customize the table's position, text size, and visibility (shwtbl).
Technical Indicators:
1.Stochastic Momentum (StochMoM):
Calculates %K and %D using the Stochastic formula.
Displays StochMoM values and colors cells based on bullish or bearish conditions.
2.Relative Strength Index (RSI):
Computes the RSI values and colors cells based on the direction of the trend.
3.MACD (Moving Average Convergence Divergence):
Calculates MACD and Signal line values.
Displays MACD values and colors cells based on bullish or bearish conditions.
Summary:
This script provides traders with a versatile tool for analyzing price trends, comparing symbols, and viewing key technical indicators. The combination of visual elements on the chart and a detailed table enhances the ability to make informed trading decisions.
This script is provided for educational purposes and does not constitute financial advice. Traders and investors should conduct their research and analysis before making any trading decisions.
オープンソーススクリプト
TradingViewの精神に則り、このスクリプトの作者はコードをオープンソースとして公開してくれました。トレーダーが内容を確認・検証できるようにという配慮です。作者に拍手を送りましょう!無料で利用できますが、コードの再公開はハウスルールに従う必要があります。
免責事項
この情報および投稿は、TradingViewが提供または推奨する金融、投資、トレード、その他のアドバイスや推奨を意図するものではなく、それらを構成するものでもありません。詳細は利用規約をご覧ください。
オープンソーススクリプト
TradingViewの精神に則り、このスクリプトの作者はコードをオープンソースとして公開してくれました。トレーダーが内容を確認・検証できるようにという配慮です。作者に拍手を送りましょう!無料で利用できますが、コードの再公開はハウスルールに従う必要があります。
免責事項
この情報および投稿は、TradingViewが提供または推奨する金融、投資、トレード、その他のアドバイスや推奨を意図するものではなく、それらを構成するものでもありません。詳細は利用規約をご覧ください。