OPEN-SOURCE SCRIPT
更新済 Market Heat Z-Score
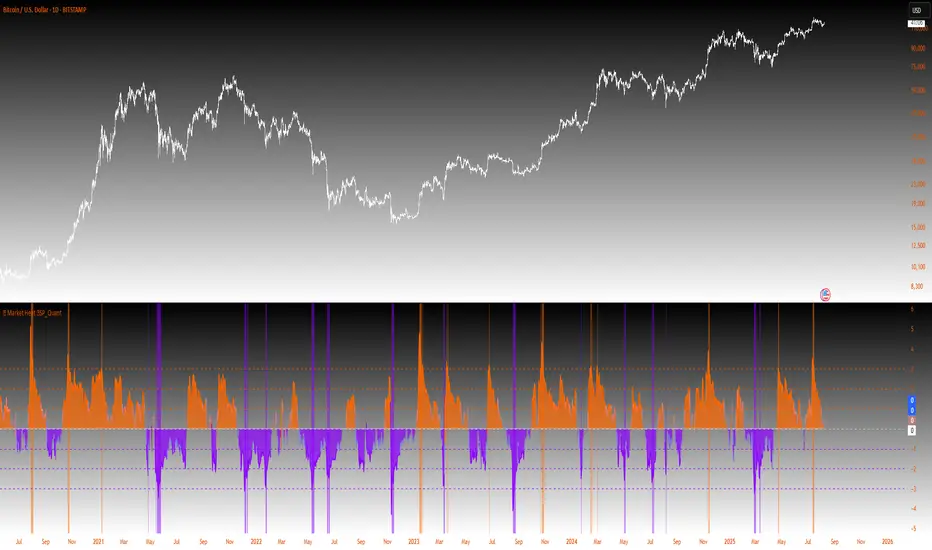
The "Market Heat Z-Score" indicator calculates the Z-score of a chosen price source over a specified lookback period, indicating how far the current price is from the mean in terms of standard deviations. It visually represents overbought and oversold conditions with a color gradient and customizable glow effect, with background shading indicating extreme Z-scores.
リリースノート
⚡ Market Heat ⚡ by SP_QuantA simple and straightforward indicator that uses Z-Score to show market strength and weakness. It highlights overbought and oversold conditions with colors and optional glow effects.
It is easy to use but can be noisy, best suited for spotting quick momentum shifts and mean-reversion setups.
Calculations use only confirmed bars to reduce repainting.
⚠️ Disclaimer:
This indicator is for educational and informational purposes only and does not constitute financial advice, trading advice, or investment recommendations. Use it at your own risk. Always perform your own analysis before making any trading decisions. The author is not liable for any losses or damages resulting from the use of this script.
オープンソーススクリプト
TradingViewの精神に則り、このスクリプトの作者はコードをオープンソースとして公開してくれました。トレーダーが内容を確認・検証できるようにという配慮です。作者に拍手を送りましょう!無料で利用できますが、コードの再公開はハウスルールに従う必要があります。
Quant strategies operating behind the efficient frontier.
Tailored for professionals.
No financial advice.
Tailored for professionals.
No financial advice.
免責事項
この情報および投稿は、TradingViewが提供または推奨する金融、投資、トレード、その他のアドバイスや推奨を意図するものではなく、それらを構成するものでもありません。詳細は利用規約をご覧ください。