INVITE-ONLY SCRIPT
更新済 MAPS - HiLo Divergence
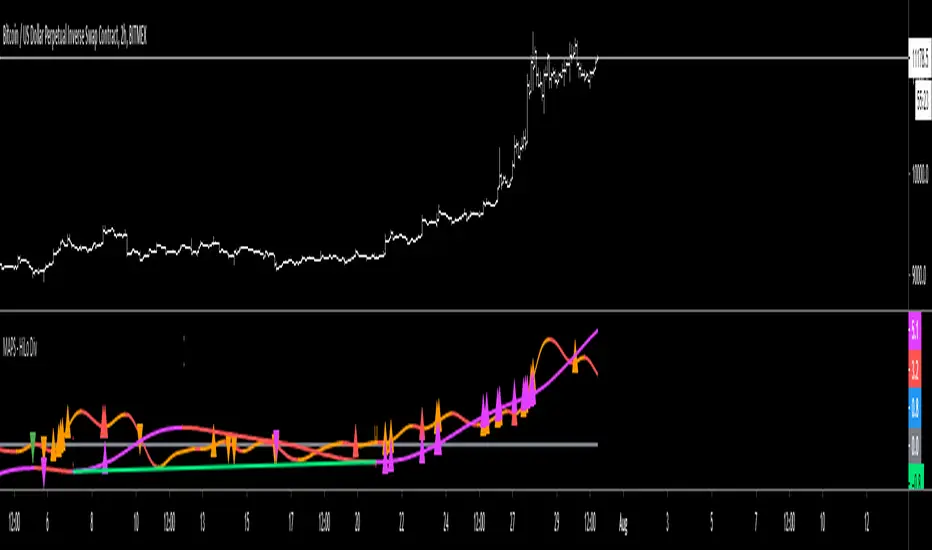
The High/Low indicator utilizes the measuring of local highs and lows as well as local peaks and troughs to identify possible divergence in the price action.
Purple oscillator = Higher Timeframe's price measurement
Purple high triangle = A local high on the higher timeframe has been made
Purple low triangle = A local low on the higher timeframe has been made
Red high triangle on the purple oscillator = A local high on the higher timeframe has been made and is deemed a bearish divergent high
Green low triangle on the purple oscillator = A local low on the higher timeframe has been made and is deemed a bullish divergent low
Orange oscillator = Current Timeframe's price measurement
Orange high triangle = A local high on the current timeframe has been made
Orange low triangle = A local low on the current timeframe has been made
Red high triangle on the orange oscillator = A local high on the current timeframe has been made and is deemed a bearish divergent high
Green low triangle on the orange oscillator = A local low on the current timeframe has been made and is deemed a bullish divergent low
リリースノート
Updated colors to show red when oscillators are moving downwards.招待専用スクリプト
このスクリプトは作者が承認したユーザーのみアクセス可能です。使用するにはアクセス申請をして許可を得る必要があります。通常は支払い後に承認されます。詳細は下記の作者の指示に従うか、TheTimeCountに直接お問い合わせください。
TradingViewは、作者を完全に信頼し、スクリプトの動作を理解していない限り、有料スクリプトの購入・使用を推奨しません。コミュニティスクリプトには無料のオープンソースの代替が多数あります。
作者の指示
DM me for access to the private indicators twitter.com/TheTimeCount
免責事項
この情報および投稿は、TradingViewが提供または推奨する金融、投資、トレード、その他のアドバイスや推奨を意図するものではなく、それらを構成するものでもありません。詳細は利用規約をご覧ください。
招待専用スクリプト
このスクリプトは作者が承認したユーザーのみアクセス可能です。使用するにはアクセス申請をして許可を得る必要があります。通常は支払い後に承認されます。詳細は下記の作者の指示に従うか、TheTimeCountに直接お問い合わせください。
TradingViewは、作者を完全に信頼し、スクリプトの動作を理解していない限り、有料スクリプトの購入・使用を推奨しません。コミュニティスクリプトには無料のオープンソースの代替が多数あります。
作者の指示
DM me for access to the private indicators twitter.com/TheTimeCount
免責事項
この情報および投稿は、TradingViewが提供または推奨する金融、投資、トレード、その他のアドバイスや推奨を意図するものではなく、それらを構成するものでもありません。詳細は利用規約をご覧ください。