OPEN-SOURCE SCRIPT
更新済 DCA Strategy

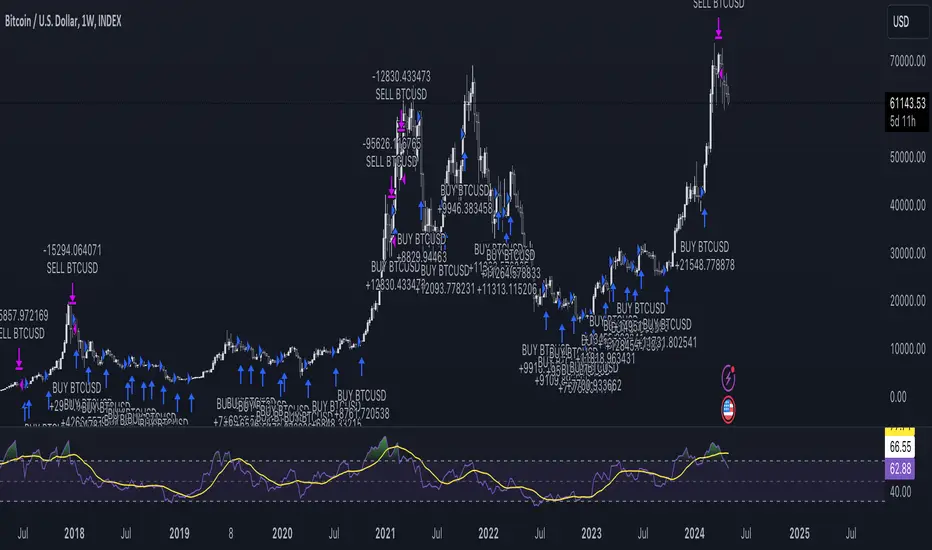
Introducing the DCA Strategy, a powerful tool for identifying long entry and exit opportunities in uptrending assets like cryptocurrencies, stocks, and gold. This strategy leverages the Heikin Ashi candlestick pattern and the RSI indicator to navigate potential price swings.
Core Functionality:
Buy Signal: A buy signal is generated when a bullish (green) Heikin Ashi candle appears after a bearish (red) one, indicating a potential reversal in a downtrend. Additionally, the RSI must be below a user-defined threshold (default: 85) to prevent buying overbought assets.
Sell Signal: The strategy exits the trade when the RSI surpasses the user-defined exit level (default: 85), suggesting the asset might be overbought.
Backtesting Flexibility: Users can customize the backtesting period by specifying the start and end years.
Key Advantages:
Overall, the DCA Strategy offers a valuable approach for traders seeking to capitalize on long opportunities in trending markets with the help of Heikin Ashi candles and RSI confirmation.
Core Functionality:
Buy Signal: A buy signal is generated when a bullish (green) Heikin Ashi candle appears after a bearish (red) one, indicating a potential reversal in a downtrend. Additionally, the RSI must be below a user-defined threshold (default: 85) to prevent buying overbought assets.
Sell Signal: The strategy exits the trade when the RSI surpasses the user-defined exit level (default: 85), suggesting the asset might be overbought.
Backtesting Flexibility: Users can customize the backtesting period by specifying the start and end years.
Key Advantages:
- Trend-Following: Designed specifically for uptrending assets, aiming to capture profitable price movements.
- Dynamic RSI Integration: The RSI indicator helps refine entry signals by avoiding overbought situations.
- User-Defined Parameters: Allows customization of exit thresholds and backtesting periods to suit individual trading preferences.
- Commission and Slippage: The script factors in realistic commission fees (0.1%) and slippage (2%) for a more accurate backtesting experience.
- Beats Buy-and-Hold: Backtesting suggests this strategy outperforms a simple buy-and-hold approach in uptrending markets.
Overall, the DCA Strategy offers a valuable approach for traders seeking to capitalize on long opportunities in trending markets with the help of Heikin Ashi candles and RSI confirmation.
リリースノート
- Increased default weekly RSI to 90
- Increased the default quantity
- Added an additional bearish Heikin Ashi candle check before an entry
リリースノート
- Updated RSI to use the Heikin Ashi close
リリースノート
- Adjusted the entry and exit RSI values
リリースノート
- Added ability to exit partially from an asset in percentage terms (default is 50%);
- Updated exit logic: exit when the RSI crosser under the specified value, instead of just being higher than the specified value.
リリースノート
- Removed additional entry check
- Added automatic exit calculation
リリースノート
- Added ability to set custom RSI exit value
- Added ability to close all trades at specific time
オープンソーススクリプト
TradingViewの精神に則り、このスクリプトの作者はコードをオープンソースとして公開してくれました。トレーダーが内容を確認・検証できるようにという配慮です。作者に拍手を送りましょう!無料で利用できますが、コードの再公開はハウスルールに従う必要があります。
免責事項
この情報および投稿は、TradingViewが提供または推奨する金融、投資、トレード、その他のアドバイスや推奨を意図するものではなく、それらを構成するものでもありません。詳細は利用規約をご覧ください。
オープンソーススクリプト
TradingViewの精神に則り、このスクリプトの作者はコードをオープンソースとして公開してくれました。トレーダーが内容を確認・検証できるようにという配慮です。作者に拍手を送りましょう!無料で利用できますが、コードの再公開はハウスルールに従う必要があります。
免責事項
この情報および投稿は、TradingViewが提供または推奨する金融、投資、トレード、その他のアドバイスや推奨を意図するものではなく、それらを構成するものでもありません。詳細は利用規約をご覧ください。