OPEN-SOURCE SCRIPT
更新済 Fixed Fibonacci Support Resistance
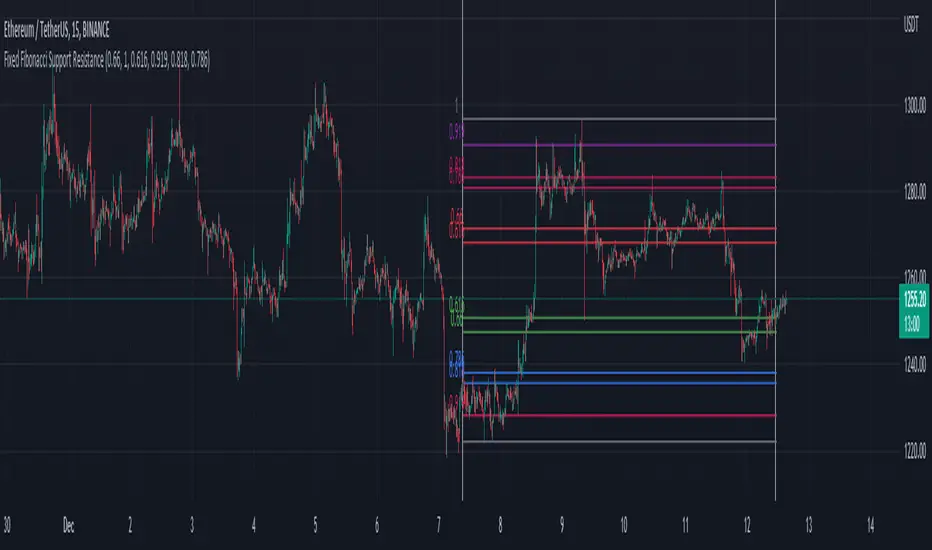
I took the formula of the fibonacci from LonesomeTheBlue and made this script. You can take a look at his indicator here: 
When you first add the indicator on the chart, click on the chart to select the first date and then the second date. It will then calculate the fibonacci support and resistance of the range you choose. You can also choose the date inside the inputs.
Be sure the first date is before the second date, otherwise it won't be able to show the fibonacci. If that happen, choose a correct date in the inputs.
リリースノート
The original code is from LonesomeTheBlue in the Fibonacci Levels MTF script.リリースノート
-Added a bool to extend the fibonacci to the right. -I changed the fibonacci to start from start time to end time instead of starting at end time.
-Added a bool to show/hide the start/end white line.
オープンソーススクリプト
TradingViewの精神に則り、このスクリプトの作者はコードをオープンソースとして公開してくれました。トレーダーが内容を確認・検証できるようにという配慮です。作者に拍手を送りましょう!無料で利用できますが、コードの再公開はハウスルールに従う必要があります。
免責事項
この情報および投稿は、TradingViewが提供または推奨する金融、投資、トレード、その他のアドバイスや推奨を意図するものではなく、それらを構成するものでもありません。詳細は利用規約をご覧ください。
オープンソーススクリプト
TradingViewの精神に則り、このスクリプトの作者はコードをオープンソースとして公開してくれました。トレーダーが内容を確認・検証できるようにという配慮です。作者に拍手を送りましょう!無料で利用できますが、コードの再公開はハウスルールに従う必要があります。
免責事項
この情報および投稿は、TradingViewが提供または推奨する金融、投資、トレード、その他のアドバイスや推奨を意図するものではなく、それらを構成するものでもありません。詳細は利用規約をご覧ください。