OPEN-SOURCE SCRIPT
Support/Resistance Breakout Detector
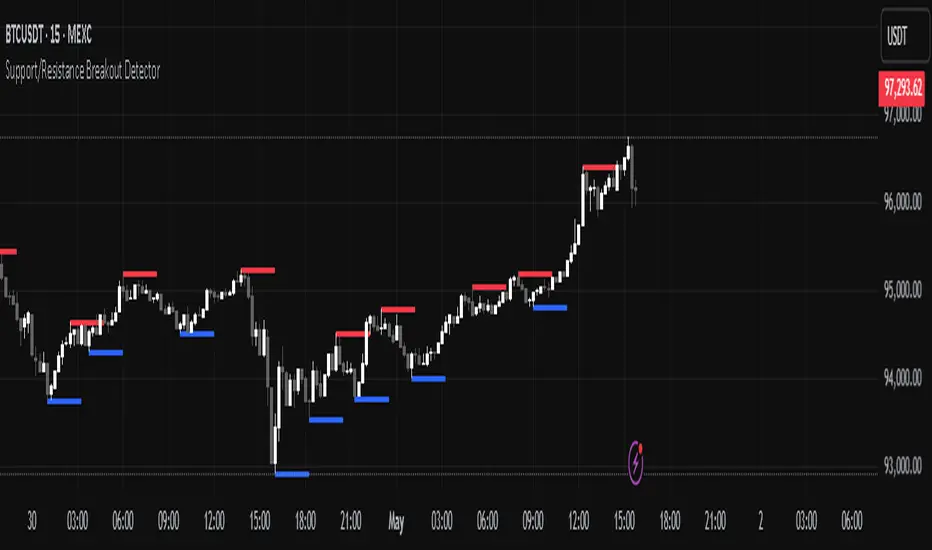
This indicator automatically detects and plots dynamic support and resistance levels using pivot highs and lows.
✅ It draws red resistance lines and blue support lines,
✅ The lines extend forward but automatically stop when the price touches them,
✅ It monitors for breakouts with strong volume,
✅ When a breakout happens, it shows labels like “B” or “Bull Wick” / “Bear Wick” on the chart,
✅ It also triggers alerts when support or resistance breaks with high volume.
Main settings:
Pivot lookback period
Show/hide breakout labels
Minimum volume for breakout
Maximum extension length for lines
This tool helps traders easily spot key price levels and watch for meaningful breakouts.
オープンソーススクリプト
TradingViewの精神に則り、このスクリプトの作者はコードをオープンソースとして公開してくれました。トレーダーが内容を確認・検証できるようにという配慮です。作者に拍手を送りましょう!無料で利用できますが、コードの再公開はハウスルールに従う必要があります。
免責事項
この情報および投稿は、TradingViewが提供または推奨する金融、投資、トレード、その他のアドバイスや推奨を意図するものではなく、それらを構成するものでもありません。詳細は利用規約をご覧ください。
オープンソーススクリプト
TradingViewの精神に則り、このスクリプトの作者はコードをオープンソースとして公開してくれました。トレーダーが内容を確認・検証できるようにという配慮です。作者に拍手を送りましょう!無料で利用できますが、コードの再公開はハウスルールに従う必要があります。
免責事項
この情報および投稿は、TradingViewが提供または推奨する金融、投資、トレード、その他のアドバイスや推奨を意図するものではなく、それらを構成するものでもありません。詳細は利用規約をご覧ください。