OPEN-SOURCE SCRIPT
HersG High Low Bar Charts Layout
Hello friends,
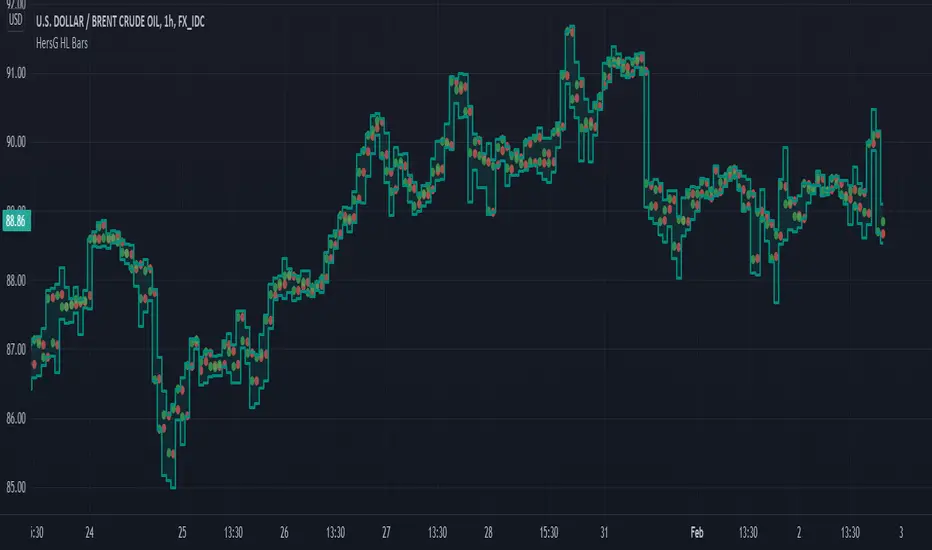
The following indicator will create a new form of chart layout in High & Low as candle-like full bars instead of Open and Close. There are no wicks, only full bars highlighting High and Low of the select time frame. Two dots inside a bar will represent Open (Red dot) and Close (Green dot).
How can it help you as a trader?
High and Low candle-like bars will clear the noise from charts in identifying support & resistance, higher-highs and lower-lows will be clearly visible thus helping you make trades.
First add the indicator and then hover the mouse pointer over the ticker in the charts and click on the “eye-shaped” symbol to hide the candlesticks chart pattern.
The type of chart layout is standard charts. Data are not re-calculated or manipulated.
Regards!
オープンソーススクリプト
TradingViewの精神に則り、このスクリプトの作者はコードをオープンソースとして公開してくれました。トレーダーが内容を確認・検証できるようにという配慮です。作者に拍手を送りましょう!無料で利用できますが、コードの再公開はハウスルールに従う必要があります。
免責事項
この情報および投稿は、TradingViewが提供または推奨する金融、投資、トレード、その他のアドバイスや推奨を意図するものではなく、それらを構成するものでもありません。詳細は利用規約をご覧ください。
オープンソーススクリプト
TradingViewの精神に則り、このスクリプトの作者はコードをオープンソースとして公開してくれました。トレーダーが内容を確認・検証できるようにという配慮です。作者に拍手を送りましょう!無料で利用できますが、コードの再公開はハウスルールに従う必要があります。
免責事項
この情報および投稿は、TradingViewが提供または推奨する金融、投資、トレード、その他のアドバイスや推奨を意図するものではなく、それらを構成するものでもありません。詳細は利用規約をご覧ください。