OPEN-SOURCE SCRIPT
Hull Oscillator
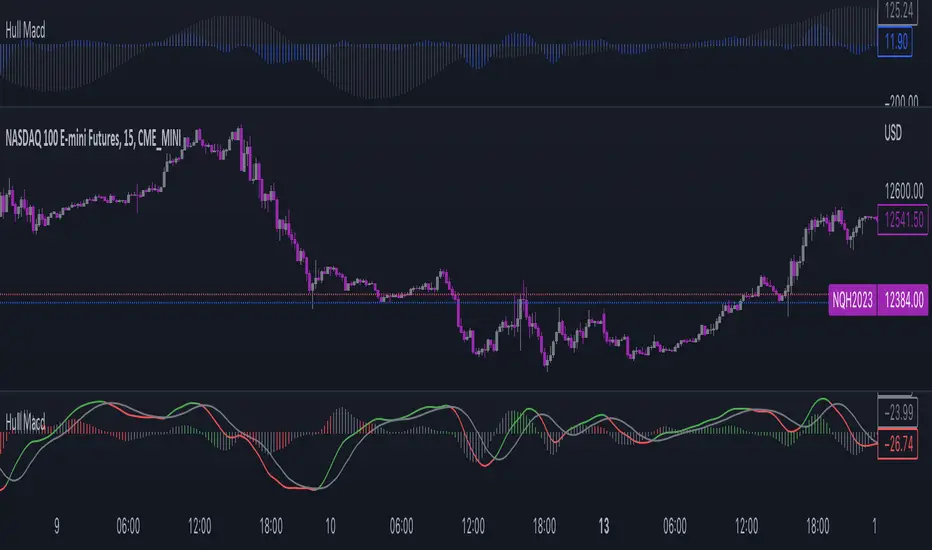
This oscillator comprehends two different indicators:
- The first one is a MACD but calculated using the Hull Moving Average.
- The second one is to show the direction in which the Hull Moving Average is going.
Notice that in the first indicator, the histogram is colored as follows:
- If the volume pressure (difference between the volume-weighted moving average and the normal one) is positive both for the short term and the long term, it's green, if negative it's red, and if not is simply gray.
This tool can be used both for:
- Analyze the direction to have a bias to follow
- Analyze the divergences
- Obtain the signal to enter and exit the trade
- Analyze the market strength with volume to confirm the signal
オープンソーススクリプト
TradingViewの精神に則り、このスクリプトの作者はコードをオープンソースとして公開してくれました。トレーダーが内容を確認・検証できるようにという配慮です。作者に拍手を送りましょう!無料で利用できますが、コードの再公開はハウスルールに従う必要があります。
免責事項
この情報および投稿は、TradingViewが提供または推奨する金融、投資、トレード、その他のアドバイスや推奨を意図するものではなく、それらを構成するものでもありません。詳細は利用規約をご覧ください。
オープンソーススクリプト
TradingViewの精神に則り、このスクリプトの作者はコードをオープンソースとして公開してくれました。トレーダーが内容を確認・検証できるようにという配慮です。作者に拍手を送りましょう!無料で利用できますが、コードの再公開はハウスルールに従う必要があります。
免責事項
この情報および投稿は、TradingViewが提供または推奨する金融、投資、トレード、その他のアドバイスや推奨を意図するものではなく、それらを構成するものでもありません。詳細は利用規約をご覧ください。