OPEN-SOURCE SCRIPT
Pressure Volume by Molnar
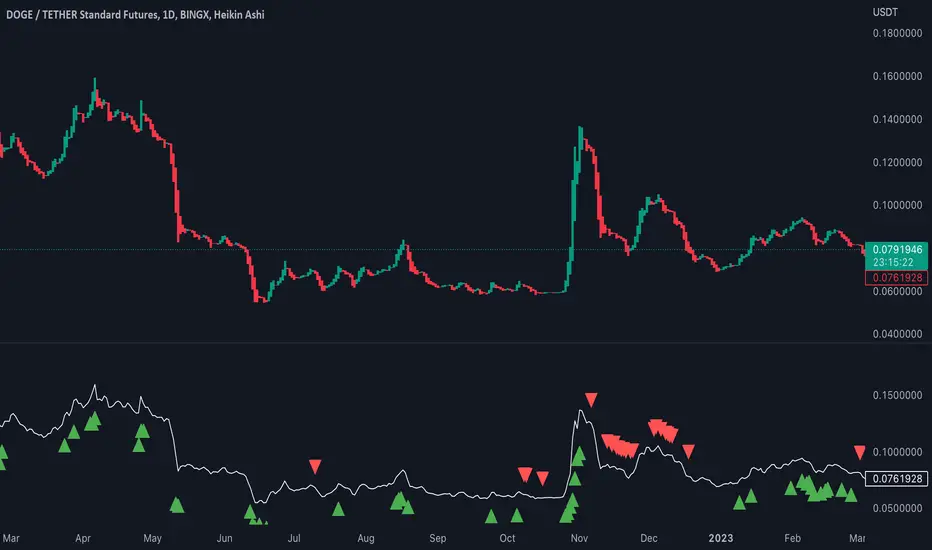
The Pressure Volume script is a technical indicator that is used to identify buying and selling pressure in a market based on changes in volume. The indicator calculates the average volume over a specified lookback period and then calculates the percentage change in volume for each bar. If the percentage change in volume exceeds a user-defined threshold, then the indicator signals the presence of buying or selling pressure.
To use the script, you simply need to add it to a chart in TradingView. The script allows you to adjust two input parameters: the lookback period and the threshold percentage. The lookback period is the number of bars to use when calculating the average volume, and the threshold percentage is the amount by which the current bar's volume must exceed the average volume in order to trigger a buying or selling pressure signal.
When the script detects buying pressure, it displays a green triangle above the bar, and when it detects selling pressure, it displays a red triangle below the bar. You can adjust the size of the triangles using the "size" input parameter.
It's important to note that the Pressure Volume script is just one tool among many that traders use to analyze the market. It should be used in conjunction with other indicators and analysis techniques to make informed trading decisions.
オープンソーススクリプト
TradingViewの精神に則り、このスクリプトの作者はコードをオープンソースとして公開してくれました。トレーダーが内容を確認・検証できるようにという配慮です。作者に拍手を送りましょう!無料で利用できますが、コードの再公開はハウスルールに従う必要があります。
免責事項
この情報および投稿は、TradingViewが提供または推奨する金融、投資、トレード、その他のアドバイスや推奨を意図するものではなく、それらを構成するものでもありません。詳細は利用規約をご覧ください。
オープンソーススクリプト
TradingViewの精神に則り、このスクリプトの作者はコードをオープンソースとして公開してくれました。トレーダーが内容を確認・検証できるようにという配慮です。作者に拍手を送りましょう!無料で利用できますが、コードの再公開はハウスルールに従う必要があります。
免責事項
この情報および投稿は、TradingViewが提供または推奨する金融、投資、トレード、その他のアドバイスや推奨を意図するものではなく、それらを構成するものでもありません。詳細は利用規約をご覧ください。