OPEN-SOURCE SCRIPT
EMA TREND
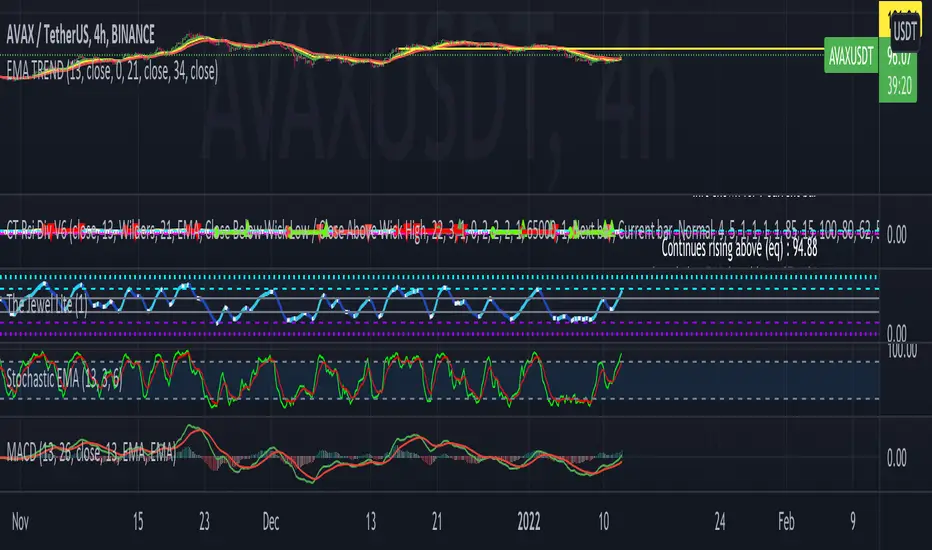
This EMA Trend indicator uses the 13 EMA, 21 EMA, and 34 EMA in the following color codes of Green for 13 EMA, Yellow for 21 EMA, and Red for 34 EMA lines to demonstrate overall trend when applied to the chart. Instead of just one EMA line, using three EMA lines to determine the trend. Use this indicator to in the following method. If the green angled up along with yellow and red, there is strong upward trend. If the green crosses below the yellow, trend is waning. If the red is on top of the yellow and green with downward slope, there is a strong downward trend.
オープンソーススクリプト
TradingViewの精神に則り、このスクリプトの作者はコードをオープンソースとして公開してくれました。トレーダーが内容を確認・検証できるようにという配慮です。作者に拍手を送りましょう!無料で利用できますが、コードの再公開はハウスルールに従う必要があります。
免責事項
この情報および投稿は、TradingViewが提供または推奨する金融、投資、トレード、その他のアドバイスや推奨を意図するものではなく、それらを構成するものでもありません。詳細は利用規約をご覧ください。
オープンソーススクリプト
TradingViewの精神に則り、このスクリプトの作者はコードをオープンソースとして公開してくれました。トレーダーが内容を確認・検証できるようにという配慮です。作者に拍手を送りましょう!無料で利用できますが、コードの再公開はハウスルールに従う必要があります。
免責事項
この情報および投稿は、TradingViewが提供または推奨する金融、投資、トレード、その他のアドバイスや推奨を意図するものではなく、それらを構成するものでもありません。詳細は利用規約をご覧ください。