OPEN-SOURCE SCRIPT
Running Equity - A New Indicator For Optimal Markets Detection
Introduction
Winning trades and gaining profits in trading is not impossible, however having gross profits superior to gross losses is what make trading challenging, it is logical to think that it is better to open a position when the probability of winning the trade is high, such probability can’t be measured with accuracy but a lot of metrics have been proposed in order to help determining when to open positions, technical analysis support the fact that a trending market is the best market condition for opening a position, which is logical when using a trend following strategy, therefore a long-term positive auto-correlated market is optimal for trading, this is why this paper present a new method for detecting optimal markets conditions in order to open a position.
The Indicator
The proposed indicator is based on the assumption that positive returns using a trend following strategy are a strong indication of trend strength, the proposed indicator is built from the conditions of a simple SMA cross trend following strategy, which are to go long when price > SMA and to go short when price < SMA. Then the equity from those conditions is built, in order to provide a more flexible indicator, length control the period of the sum.

When the indicator is positive it means that the market allow for potential returns, it can thus be considered being trending. Else a negative value of the indicator indicate a ranging market that won't allow for returns.
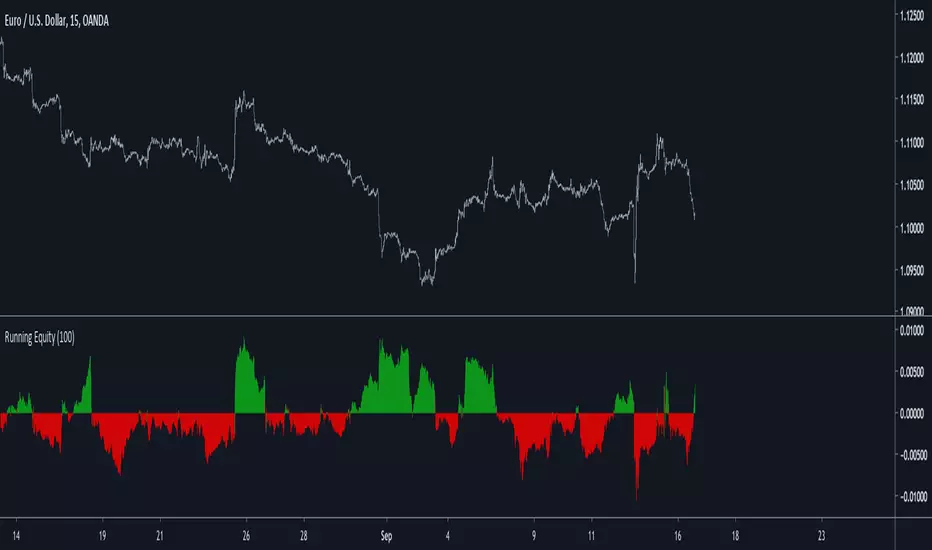
Filtering Bad Trades
The indicator can be used to filter bad trades entries, in this example a Bollinger band breakout strategy is used, without any changes the strategy return the following equity on EURUSD

The proposed indicator is then applied with the following conditions : buy and sell only if Req > 0

With an indicator period = 100 we filtered unprofitable trades.
Conclusion
I presented a new indicator for the detection of optimal markets based on a running equity. I hope both indicators may find applications in technical analysis and help investors get pertinent outputs from them.
it would mean a lot if you could read the original paper : figshare.com/articles/A_New_Technical_Indicator_For_Optimal_Markets_Detection/9825752
Winning trades and gaining profits in trading is not impossible, however having gross profits superior to gross losses is what make trading challenging, it is logical to think that it is better to open a position when the probability of winning the trade is high, such probability can’t be measured with accuracy but a lot of metrics have been proposed in order to help determining when to open positions, technical analysis support the fact that a trending market is the best market condition for opening a position, which is logical when using a trend following strategy, therefore a long-term positive auto-correlated market is optimal for trading, this is why this paper present a new method for detecting optimal markets conditions in order to open a position.
The Indicator
The proposed indicator is based on the assumption that positive returns using a trend following strategy are a strong indication of trend strength, the proposed indicator is built from the conditions of a simple SMA cross trend following strategy, which are to go long when price > SMA and to go short when price < SMA. Then the equity from those conditions is built, in order to provide a more flexible indicator, length control the period of the sum.
When the indicator is positive it means that the market allow for potential returns, it can thus be considered being trending. Else a negative value of the indicator indicate a ranging market that won't allow for returns.
Filtering Bad Trades
The indicator can be used to filter bad trades entries, in this example a Bollinger band breakout strategy is used, without any changes the strategy return the following equity on EURUSD
The proposed indicator is then applied with the following conditions : buy and sell only if Req > 0
With an indicator period = 100 we filtered unprofitable trades.
Conclusion
I presented a new indicator for the detection of optimal markets based on a running equity. I hope both indicators may find applications in technical analysis and help investors get pertinent outputs from them.
it would mean a lot if you could read the original paper : figshare.com/articles/A_New_Technical_Indicator_For_Optimal_Markets_Detection/9825752
オープンソーススクリプト
TradingViewの精神に則り、このスクリプトの作者はコードをオープンソースとして公開してくれました。トレーダーが内容を確認・検証できるようにという配慮です。作者に拍手を送りましょう!無料で利用できますが、コードの再公開はハウスルールに従う必要があります。
Check out the indicators we are making at luxalgo: tradingview.com/u/LuxAlgo/
"My heart is so loud that I can't hear the fireworks"
"My heart is so loud that I can't hear the fireworks"
免責事項
この情報および投稿は、TradingViewが提供または推奨する金融、投資、トレード、その他のアドバイスや推奨を意図するものではなく、それらを構成するものでもありません。詳細は利用規約をご覧ください。