OPEN-SOURCE SCRIPT
Black Belt cloud

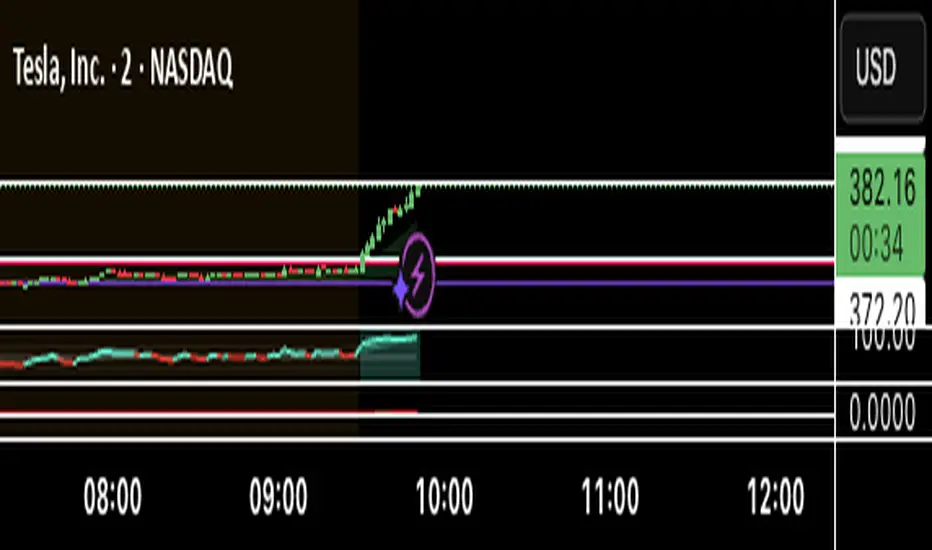
The EMA Cloud indicator highlights market trend direction by filling the space between multiple exponential moving averages with dynamic color-coded clouds.
When the market is in a bullish alignment, the cloud turns green, signaling strong upward momentum.
When the market shifts into a bearish alignment, the cloud turns red, warning of downside pressure.
During periods of mixed or uncertain conditions, the cloud appears gray to indicate potential consolidation or indecision.
The indicator also includes alerts that trigger only on trend changes, helping traders react quickly when momentum shifts.
This tool makes it easy to:
Visualize trend strength at a glance
Avoid choppy, sideways market conditions
Combine with entry/exit strategies for improved decision-making
オープンソーススクリプト
TradingViewの精神に則り、この作者はスクリプトのソースコードを公開しているので、その内容を理解し検証することができます。作者に感謝です!無料でお使いいただけますが、このコードを投稿に再利用する際にはハウスルールに従うものとします。
免責事項
これらの情報および投稿は、TradingViewが提供または保証する金融、投資、取引、またはその他の種類のアドバイスや推奨を意図したものではなく、またそのようなものでもありません。詳しくは利用規約をご覧ください。
オープンソーススクリプト
TradingViewの精神に則り、この作者はスクリプトのソースコードを公開しているので、その内容を理解し検証することができます。作者に感謝です!無料でお使いいただけますが、このコードを投稿に再利用する際にはハウスルールに従うものとします。
免責事項
これらの情報および投稿は、TradingViewが提供または保証する金融、投資、取引、またはその他の種類のアドバイスや推奨を意図したものではなく、またそのようなものでもありません。詳しくは利用規約をご覧ください。