OPEN-SOURCE SCRIPT
MTFHTS with Moving Average Ribbon and Buy/Sell Signals 3.2
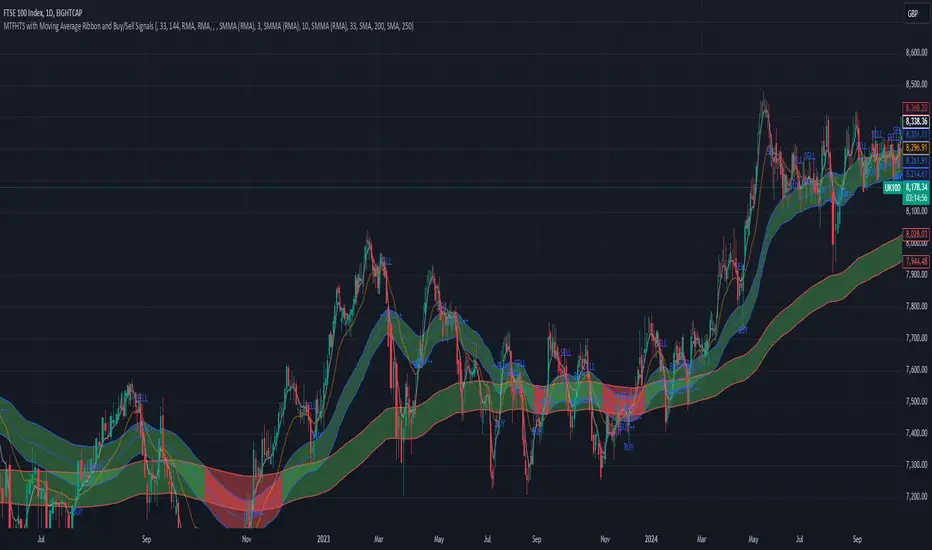
Multi-Timeframe Moving Average Strategy with Buy and Sell Signals
Purpose
This strategy is designed to provide clear, data-driven buy and sell signals based on moving average crossovers across multiple timeframes. It aims to help traders identify potential trend reversals and entry/exit points using a systematic approach.
How it Works
Moving Averages Across Multiple Timeframes:
Five customizable moving averages (MA №1 to MA №5) are calculated using different lengths and types, including SMA, EMA, WMA, and VWMA, to suit various trading styles.
The MAs are plotted on different timeframes, allowing traders to visualize trend alignment and identify market momentum across short, medium, and long terms.
Signals for Buying and Selling:
Buy Signals: When the shorter-term MA (MA №1) crosses above a longer-term MA (MA №2 or MA №3), the strategy triggers a buy signal, indicating potential upward momentum.
Sell Signals: When MA №1 crosses below a longer-term MA (MA №2 or MA №3), a sell signal is triggered, suggesting potential downward movement.
Visual Aids and Alerts:
The strategy uses color fills between MAs to indicate bullish (green) or bearish (red) trends, helping traders assess market conditions at a glance.
Alerts for buy and sell signals keep traders notified in real-time, helping to avoid missed opportunities.
Important Note
This strategy is purely educational and does not constitute investment advice. It serves as a tool to help traders understand how multi-timeframe moving averages and crossovers can be used in technical analysis. As with any trading strategy, we recommend testing in a simulated environment and exercising caution.
オープンソーススクリプト
TradingViewの精神に則り、このスクリプトの作者はコードをオープンソースとして公開してくれました。トレーダーが内容を確認・検証できるようにという配慮です。作者に拍手を送りましょう!無料で利用できますが、コードの再公開はハウスルールに従う必要があります。
免責事項
この情報および投稿は、TradingViewが提供または推奨する金融、投資、トレード、その他のアドバイスや推奨を意図するものではなく、それらを構成するものでもありません。詳細は利用規約をご覧ください。
オープンソーススクリプト
TradingViewの精神に則り、このスクリプトの作者はコードをオープンソースとして公開してくれました。トレーダーが内容を確認・検証できるようにという配慮です。作者に拍手を送りましょう!無料で利用できますが、コードの再公開はハウスルールに従う必要があります。
免責事項
この情報および投稿は、TradingViewが提供または推奨する金融、投資、トレード、その他のアドバイスや推奨を意図するものではなく、それらを構成するものでもありません。詳細は利用規約をご覧ください。