OPEN-SOURCE SCRIPT
Support and Resistance
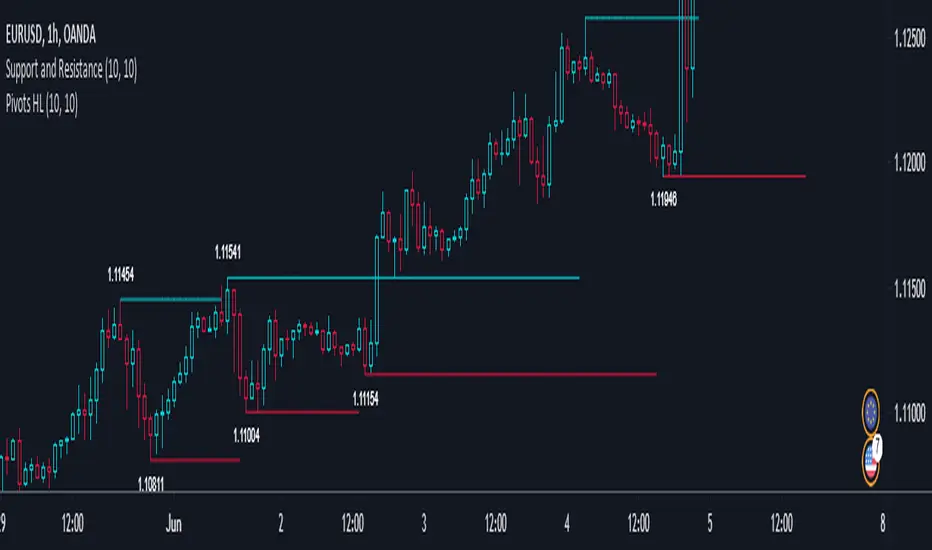
1. This indicator draw line at the pivot point to show possible support and resistance area.
2. The way it is drawn is pretty simple. Every time a pivot point is formed, a line is drawn on top of it.
3. The line will be delayed due to the nature of pivot point itself.
2. The way it is drawn is pretty simple. Every time a pivot point is formed, a line is drawn on top of it.
3. The line will be delayed due to the nature of pivot point itself.
オープンソーススクリプト
TradingViewの精神に則り、このスクリプトの作者はコードをオープンソースとして公開してくれました。トレーダーが内容を確認・検証できるようにという配慮です。作者に拍手を送りましょう!無料で利用できますが、コードの再公開はハウスルールに従う必要があります。
免責事項
この情報および投稿は、TradingViewが提供または推奨する金融、投資、トレード、その他のアドバイスや推奨を意図するものではなく、それらを構成するものでもありません。詳細は利用規約をご覧ください。
オープンソーススクリプト
TradingViewの精神に則り、このスクリプトの作者はコードをオープンソースとして公開してくれました。トレーダーが内容を確認・検証できるようにという配慮です。作者に拍手を送りましょう!無料で利用できますが、コードの再公開はハウスルールに従う必要があります。
免責事項
この情報および投稿は、TradingViewが提供または推奨する金融、投資、トレード、その他のアドバイスや推奨を意図するものではなく、それらを構成するものでもありません。詳細は利用規約をご覧ください。