OPEN-SOURCE SCRIPT
更新済 Euler Cubes - Cubᵋ
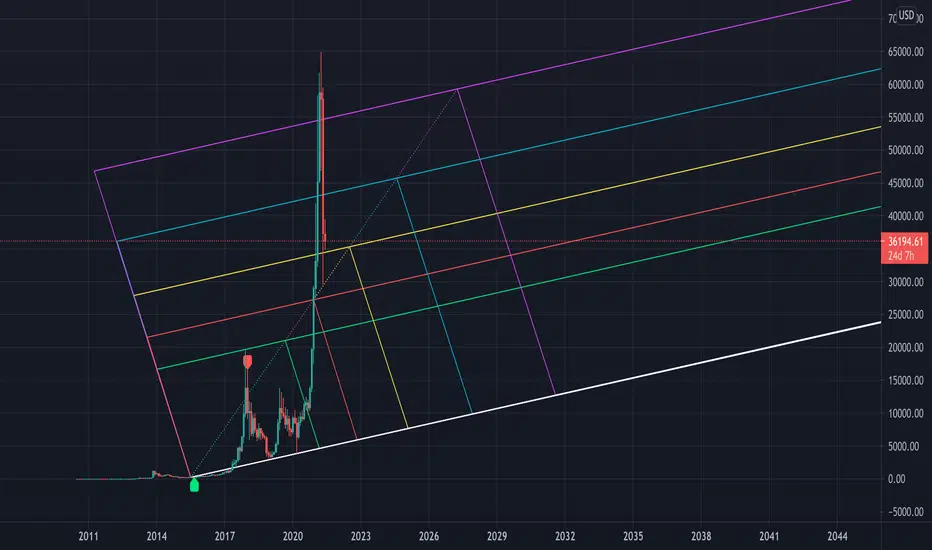
I give you the "Euler Cubes", inspired by the mathematical number 'e' (Euler's number).
It is suggested (fibonacci ratios analogy) that price/e ratio can give Support/Resistance area's.
The first cube is made by a low/high of choice, for example:

You set the 'source low'/'source high' in position:

Then you choose the 'e ratio' (x times 'e')
This multiplies the distance 'high-low' times '0.271828' times 'the set number'.
For example, choosing 5 gives 5x 0.271828 = 1.35914, the distance 'high-low' hereby multiplied by 1.35914, the following cubes multiply the previous distance by 1.35914.
(Settings below 5 will give cubes smaller than the 'high-low' distance)
In the case of x times 'e' = 5:

You can extend the lines:

Now you can give it an angle:


Do mind, using it over very little bars and using an angle can cause some lines to not align as intended, because for now, it is not possible to plot in between bars.

There are also 'Euler' SMA and EMA available with following length's:
27, 54, 82,109, 136, 163, 190 and 217


Cheers!
It is suggested (fibonacci ratios analogy) that price/e ratio can give Support/Resistance area's.
The first cube is made by a low/high of choice, for example:
You set the 'source low'/'source high' in position:
Then you choose the 'e ratio' (x times 'e')
This multiplies the distance 'high-low' times '0.271828' times 'the set number'.
For example, choosing 5 gives 5x 0.271828 = 1.35914, the distance 'high-low' hereby multiplied by 1.35914, the following cubes multiply the previous distance by 1.35914.
(Settings below 5 will give cubes smaller than the 'high-low' distance)
In the case of x times 'e' = 5:
You can extend the lines:
Now you can give it an angle:
Do mind, using it over very little bars and using an angle can cause some lines to not align as intended, because for now, it is not possible to plot in between bars.
There are also 'Euler' SMA and EMA available with following length's:
27, 54, 82,109, 136, 163, 190 and 217
Cheers!
リリースノート
When you want to choose a bar way back in history, you can enable 'Year - Month - Day', choose the date, and work from there further back
リリースノート
Added constant's:- Euler-Mascheroni constant gamma γ = 0.57721566490153286060651209008240243...
('Euler's constant', not to be confused with the constant e=2.718281...)
- golden ratio conjugate constant = 0.6180339887498948 = math.rphi
- the golden ratio constant = 1.6180339887498948 = math.phi
- Euler's number (Leonhard Euler) e = 2,71828182845904523536028747135266249... = math.e
- Archimedes' constant pi π = 3.1415926535897932 = math.pi
- constant of Mitchell Feigenbaum δ ≈ 4.66920160910299067185320382046620161...
オープンソーススクリプト
TradingViewの精神に則り、このスクリプトの作者はコードをオープンソースとして公開してくれました。トレーダーが内容を確認・検証できるようにという配慮です。作者に拍手を送りましょう!無料で利用できますが、コードの再公開はハウスルールに従う必要があります。
Who are PineCoders?
tradingview.com/chart/SSP/yW5eOqtm-Who-are-PineCoders/
TG Pine Script® Q&A: t.me/PineCodersQA
- We cannot control our emotions,
but we can control our keyboard -
tradingview.com/chart/SSP/yW5eOqtm-Who-are-PineCoders/
TG Pine Script® Q&A: t.me/PineCodersQA
- We cannot control our emotions,
but we can control our keyboard -
免責事項
この情報および投稿は、TradingViewが提供または推奨する金融、投資、トレード、その他のアドバイスや推奨を意図するものではなく、それらを構成するものでもありません。詳細は利用規約をご覧ください。